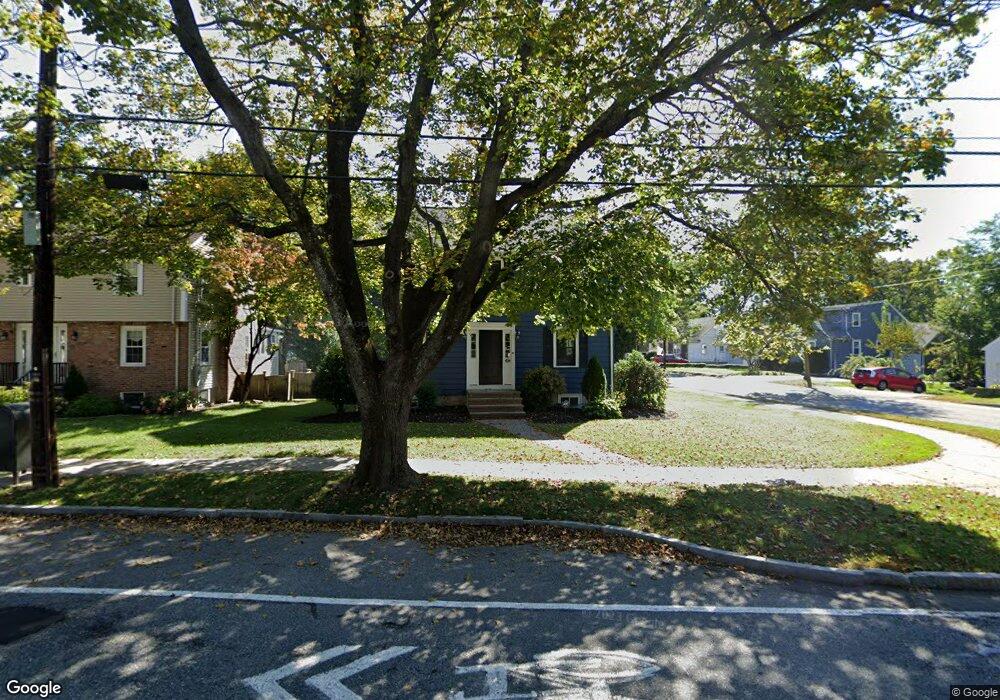
127 Cross St Belmont, MA 02478
Belmont Center NeighborhoodEstimated Value: $1,206,000 - $1,349,279
3
Beds
2
Baths
1,488
Sq Ft
$851/Sq Ft
Est. Value
About This Home
This home is located at 127 Cross St, Belmont, MA 02478 and is currently estimated at $1,266,070, approximately $850 per square foot. 127 Cross St is a home located in Middlesex County with nearby schools including Winn Brook Elementary School, Winthrop L Chenery Middle School, and Belmont High School.
Ownership History
Date
Name
Owned For
Owner Type
Purchase Details
Closed on
Jun 26, 1996
Sold by
Hanify Helen S Est
Bought by
Longboy Arnold L
Current Estimated Value
Home Financials for this Owner
Home Financials are based on the most recent Mortgage that was taken out on this home.
Original Mortgage
$247,950
Interest Rate
8.05%
Mortgage Type
Purchase Money Mortgage
Create a Home Valuation Report for This Property
The Home Valuation Report is an in-depth analysis detailing your home's value as well as a comparison with similar homes in the area
Home Values in the Area
Average Home Value in this Area
Purchase History
| Date | Buyer | Sale Price | Title Company |
|---|---|---|---|
| Longboy Arnold L | $261,000 | -- |
Source: Public Records
Mortgage History
| Date | Status | Borrower | Loan Amount |
|---|---|---|---|
| Open | Longboy Arnold L | $70,500 | |
| Closed | Longboy Arnold L | $31,000 | |
| Open | Longboy Arnold L | $246,000 | |
| Closed | Longboy Arnold L | $247,950 |
Source: Public Records
Tax History Compared to Growth
Tax History
| Year | Tax Paid | Tax Assessment Tax Assessment Total Assessment is a certain percentage of the fair market value that is determined by local assessors to be the total taxable value of land and additions on the property. | Land | Improvement |
|---|---|---|---|---|
| 2025 | $13,167 | $1,156,000 | $593,000 | $563,000 |
| 2024 | $12,250 | $1,160,000 | $698,000 | $462,000 |
| 2023 | $12,589 | $1,120,000 | $698,000 | $422,000 |
| 2022 | $11,563 | $1,023,000 | $638,000 | $385,000 |
| 2021 | $11,563 | $1,002,000 | $632,000 | $370,000 |
| 2020 | $9,801 | $891,000 | $623,000 | $268,000 |
| 2019 | $9,184 | $787,000 | $510,000 | $277,000 |
| 2018 | $17,718 | $730,000 | $459,000 | $271,000 |
| 2017 | $3,228 | $689,000 | $421,000 | $268,000 |
| 2016 | $8,641 | $688,000 | $421,000 | $267,000 |
| 2015 | $7,972 | $618,000 | $358,000 | $260,000 |
Source: Public Records
Map
Nearby Homes
- 7 Broad St
- 176 Channing Rd
- 129 Alexander Ave
- 125 Channing Rd
- 125 Claflin St
- 242 Claflin St
- 51 Stella Rd
- 314 Channing Rd
- 1 Spinney Terrace
- 38 Myrtle St
- 33 Wellington Ln
- 73 Trowbridge St Unit 73B
- 73 Trowbridge St Unit 73A
- 326 Lake St
- 335 Lake St
- 10 Radcliffe Rd
- 560 Concord Ave
- 9 Venner Rd
- 16 Fairmont St
- 23 Centre Ave