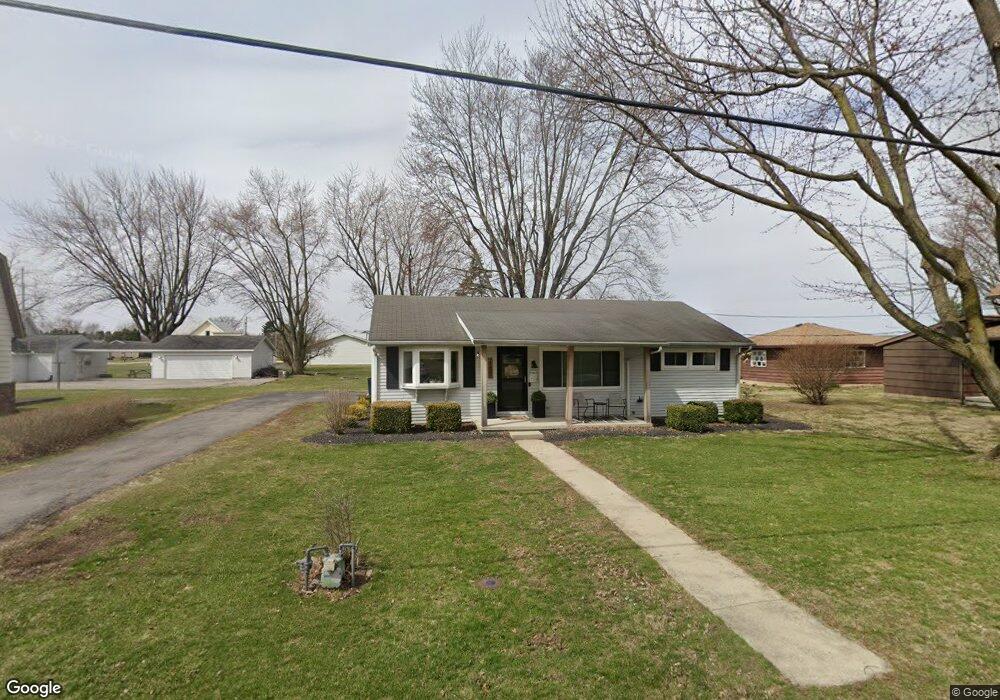
127 Deblanche Ave Columbus Grove, OH 45830
Estimated Value: $152,867 - $186,000
--
Bed
1
Bath
1,212
Sq Ft
$139/Sq Ft
Est. Value
About This Home
This home is located at 127 Deblanche Ave, Columbus Grove, OH 45830 and is currently estimated at $168,717, approximately $139 per square foot. 127 Deblanche Ave is a home located in Putnam County with nearby schools including Columbus Grove Elementary School, Columbus Grove Middle School, and Columbus Grove High School.
Ownership History
Date
Name
Owned For
Owner Type
Purchase Details
Closed on
Jan 18, 2018
Sold by
Kruse Roger P and Kruse Linda L
Bought by
Nesler Laura M
Current Estimated Value
Home Financials for this Owner
Home Financials are based on the most recent Mortgage that was taken out on this home.
Original Mortgage
$84,550
Outstanding Balance
$71,332
Interest Rate
3.93%
Mortgage Type
New Conventional
Estimated Equity
$97,385
Purchase Details
Closed on
Oct 12, 2006
Sold by
Griffith Gregory A and Griffith Daniel E
Bought by
Kruse Roger P and Kruse Linda L
Home Financials for this Owner
Home Financials are based on the most recent Mortgage that was taken out on this home.
Original Mortgage
$64,890
Interest Rate
6.5%
Mortgage Type
New Conventional
Purchase Details
Closed on
Feb 22, 2006
Sold by
Griffith Donald and Griffith Ruth
Bought by
Griffith Gregory A and Griffith Daniel E
Create a Home Valuation Report for This Property
The Home Valuation Report is an in-depth analysis detailing your home's value as well as a comparison with similar homes in the area
Home Values in the Area
Average Home Value in this Area
Purchase History
| Date | Buyer | Sale Price | Title Company |
|---|---|---|---|
| Nesler Laura M | $89,000 | None Available | |
| Kruse Roger P | $72,000 | None Available | |
| Griffith Gregory A | -- | None Available |
Source: Public Records
Mortgage History
| Date | Status | Borrower | Loan Amount |
|---|---|---|---|
| Open | Nesler Laura M | $84,550 | |
| Previous Owner | Kruse Roger P | $64,890 |
Source: Public Records
Tax History Compared to Growth
Tax History
| Year | Tax Paid | Tax Assessment Tax Assessment Total Assessment is a certain percentage of the fair market value that is determined by local assessors to be the total taxable value of land and additions on the property. | Land | Improvement |
|---|---|---|---|---|
| 2024 | $1,288 | $39,050 | $3,630 | $35,420 |
| 2023 | $1,361 | $25,250 | $2,820 | $22,430 |
| 2022 | $1,016 | $25,253 | $2,821 | $22,432 |
| 2021 | $966 | $25,250 | $2,820 | $22,430 |
| 2020 | $966 | $22,220 | $2,520 | $19,700 |
| 2019 | $947 | $25,250 | $2,820 | $22,430 |
| 2018 | $964 | $25,250 | $2,820 | $22,430 |
| 2017 | $838 | $25,250 | $2,820 | $22,430 |
| 2016 | $838 | $22,220 | $2,520 | $19,700 |
| 2015 | $842 | $22,220 | $2,520 | $19,700 |
| 2014 | $850 | $22,220 | $2,520 | $19,700 |
| 2013 | $849 | $22,220 | $2,520 | $19,700 |
Source: Public Records
Map
Nearby Homes
- 209 Willow Bend Dr
- 308 Delphos Rd
- 205 S Broadway St
- 204 S Broadway St
- 11059 Ottawa Rd
- 147 Elm St
- 148 S Water St
- 15105 Road 15m
- 704 Sherman St
- 17429 Road 5
- 00000 Ohio 696
- 000 Ohio 696
- 0000 Ohio 696
- 208 E Monroe St
- 101 Maplewood Dr
- 6585 Ottawa Rd
- 8160 Columbus Grove-Bluffton Rd
- 201 Wall St
- 309 Wall St
- 220 Parklane Dr