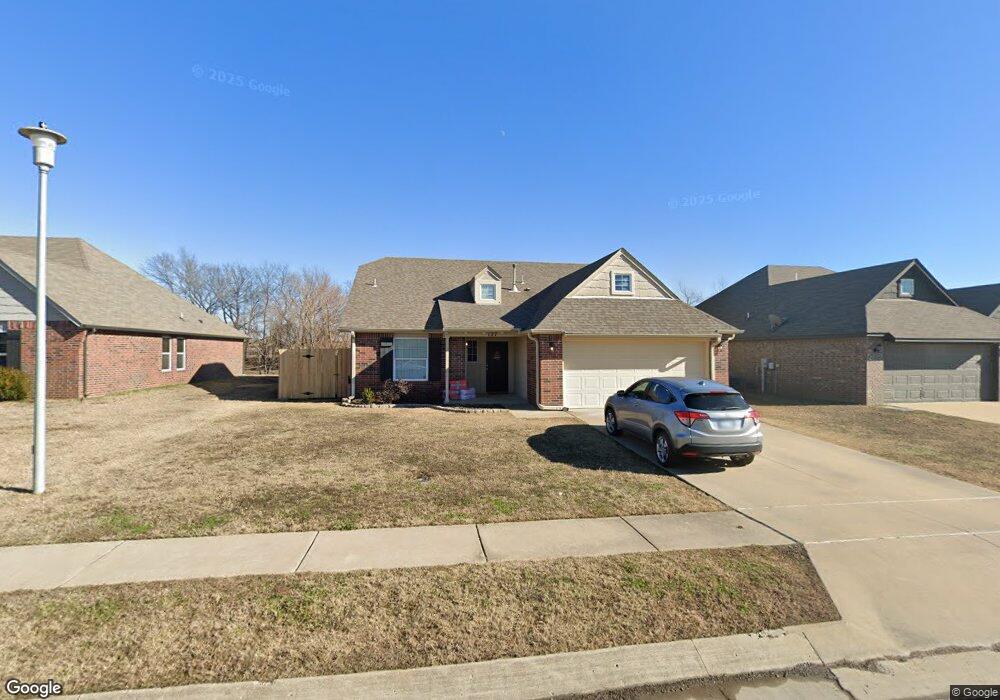
127 Dp Newman Cir Kiefer, OK 74041
Estimated Value: $242,715 - $267,000
--
Bed
--
Bath
1,587
Sq Ft
$162/Sq Ft
Est. Value
About This Home
This home is located at 127 Dp Newman Cir, Kiefer, OK 74041 and is currently estimated at $256,429, approximately $161 per square foot. 127 Dp Newman Cir is a home located in Creek County with nearby schools including Kiefer Elementary School, Rongey Middle School, and Kiefer High School.
Ownership History
Date
Name
Owned For
Owner Type
Purchase Details
Closed on
Apr 8, 2016
Sold by
Leach Freda Mae
Bought by
Price Daniel
Current Estimated Value
Home Financials for this Owner
Home Financials are based on the most recent Mortgage that was taken out on this home.
Original Mortgage
$146,015
Outstanding Balance
$115,532
Interest Rate
3.64%
Mortgage Type
New Conventional
Estimated Equity
$140,897
Purchase Details
Closed on
Aug 13, 2012
Sold by
Anderson Mcdole Investments Llc
Bought by
Leach Freda Mae
Home Financials for this Owner
Home Financials are based on the most recent Mortgage that was taken out on this home.
Original Mortgage
$43,500
Interest Rate
3.63%
Mortgage Type
New Conventional
Purchase Details
Closed on
Apr 5, 2012
Sold by
Secretary Of H U D
Bought by
Anderson Mcdole Investments Llc
Home Financials for this Owner
Home Financials are based on the most recent Mortgage that was taken out on this home.
Original Mortgage
$83,995
Interest Rate
3.92%
Mortgage Type
Unknown
Create a Home Valuation Report for This Property
The Home Valuation Report is an in-depth analysis detailing your home's value as well as a comparison with similar homes in the area
Home Values in the Area
Average Home Value in this Area
Purchase History
| Date | Buyer | Sale Price | Title Company |
|---|---|---|---|
| Price Daniel | $142,000 | Integrity Title & Closing Ll | |
| Leach Freda Mae | $133,500 | None Available | |
| Anderson Mcdole Investments Llc | -- | None Available |
Source: Public Records
Mortgage History
| Date | Status | Borrower | Loan Amount |
|---|---|---|---|
| Open | Price Daniel | $146,015 | |
| Previous Owner | Leach Freda Mae | $43,500 | |
| Previous Owner | Anderson Mcdole Investments Llc | $83,995 |
Source: Public Records
Tax History Compared to Growth
Tax History
| Year | Tax Paid | Tax Assessment Tax Assessment Total Assessment is a certain percentage of the fair market value that is determined by local assessors to be the total taxable value of land and additions on the property. | Land | Improvement |
|---|---|---|---|---|
| 2025 | $2,029 | $19,828 | $2,868 | $16,960 |
| 2024 | $1,963 | $18,883 | $2,868 | $16,015 |
| 2023 | $1,963 | $17,984 | $2,868 | $15,116 |
| 2022 | $1,718 | $17,128 | $2,868 | $14,260 |
| 2021 | $1,754 | $16,312 | $2,868 | $13,444 |
| 2020 | $1,689 | $16,131 | $2,868 | $13,263 |
| 2019 | $1,756 | $17,013 | $2,868 | $14,145 |
| 2018 | $1,751 | $17,013 | $2,868 | $14,145 |
| 2017 | $1,690 | $17,013 | $2,868 | $14,145 |
| 2016 | $1,653 | $18,522 | $2,647 | $15,875 |
| 2015 | -- | $18,522 | $2,647 | $15,875 |
| 2014 | -- | $18,522 | $2,647 | $15,875 |
Source: Public Records
Map
Nearby Homes
- 134 Dp Newman Cir
- 129 Dp Newman Cir
- 205 Vail Cir
- 205 Taos Dr
- 112 Stark St
- 803 W 150th St
- 15375 S 26th West Ave
- 311 E Indiana
- 33 Mary
- 571 W 149th Place
- 8 Ryan Place
- 467 W 147th Place S
- 14603 S Xenophon Ave
- 341 N Main St
- 15715 S Broadway St
- 110 E 156th Place S
- 41 E 148th St
- 14336 S Barber St
- 13708 S Elwood Ave
- 14812 S Fern Place
- 127 D P Newman Cir
- 129 D P Newman Cir
- 125 Dp Newman Cir
- 125 D P Newman Cir
- 123 Dp Newman Cir
- 131 Dp Newman Cir
- 131 D P Newman Cir
- 128 Dp Newman Cir
- 126 D P Newman Cir
- 124 Dp Newman Cir
- 128 D P Newman Cir
- 121 D P Newman Cir
- 133 Dp Newman Cir
- 124 D P Newman Cir
- 133 D P Newman Cir
- 122 Dp Newman Cir
- 122 D P Newman Cir
- 132 D P Newman Cir
- 119 D P Newman Cir
- 135 Dp Newman Cir