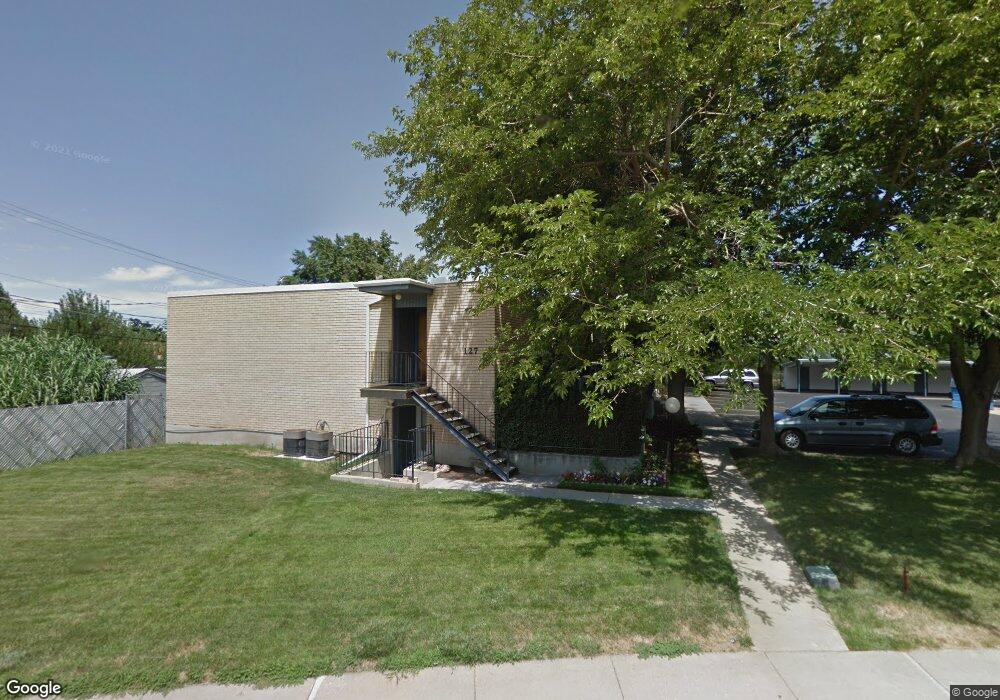
127 E 1100 N Unit 7 Bountiful, UT 84010
Estimated Value: $260,753 - $285,000
2
Beds
1
Bath
877
Sq Ft
$308/Sq Ft
Est. Value
About This Home
This home is located at 127 E 1100 N Unit 7, Bountiful, UT 84010 and is currently estimated at $269,688, approximately $307 per square foot. 127 E 1100 N Unit 7 is a home located in Davis County with nearby schools including Tolman School, Bountiful Junior High School, and Viewmont High School.
Ownership History
Date
Name
Owned For
Owner Type
Purchase Details
Closed on
Apr 10, 2023
Sold by
Italasano Scott M and Italasano Elizabeth A
Bought by
Italasano Scott M and Italasano Elizabeth A
Current Estimated Value
Purchase Details
Closed on
Feb 11, 2020
Sold by
Zumwalt Michael D and Zumwalt Jeanette
Bought by
Cochran Cynthia
Home Financials for this Owner
Home Financials are based on the most recent Mortgage that was taken out on this home.
Original Mortgage
$150,350
Interest Rate
3.72%
Mortgage Type
New Conventional
Purchase Details
Closed on
Aug 18, 2017
Sold by
Copelan Melanie
Bought by
Zumwalt Michael D and Zumwalt Jeanette
Purchase Details
Closed on
Nov 27, 2012
Sold by
Forde Arlene D
Bought by
Johnson Kyle and Johnson Ashley
Home Financials for this Owner
Home Financials are based on the most recent Mortgage that was taken out on this home.
Original Mortgage
$72,039
Interest Rate
3.33%
Mortgage Type
FHA
Create a Home Valuation Report for This Property
The Home Valuation Report is an in-depth analysis detailing your home's value as well as a comparison with similar homes in the area
Purchase History
| Date | Buyer | Sale Price | Title Company |
|---|---|---|---|
| Italasano Scott M | -- | None Listed On Document | |
| Cochran Cynthia | -- | Cottonwood Title Ins Ag | |
| Zumwalt Michael D | -- | -- | |
| Johnson Kyle | -- | North American Title |
Source: Public Records
Mortgage History
| Date | Status | Borrower | Loan Amount |
|---|---|---|---|
| Previous Owner | Cochran Cynthia | $150,350 | |
| Previous Owner | Johnson Kyle | $72,039 |
Source: Public Records
Tax History
| Year | Tax Paid | Tax Assessment Tax Assessment Total Assessment is a certain percentage of the fair market value that is determined by local assessors to be the total taxable value of land and additions on the property. | Land | Improvement |
|---|---|---|---|---|
| 2025 | $1,384 | $127,600 | $48,950 | $78,650 |
| 2024 | $1,326 | $124,850 | $54,450 | $70,400 |
| 2023 | $1,281 | $219,000 | $93,000 | $126,000 |
| 2022 | $1,280 | $119,900 | $32,450 | $87,450 |
| 2021 | $1,234 | $177,000 | $46,000 | $131,000 |
| 2020 | $1,079 | $155,000 | $42,600 | $112,400 |
| 2019 | $977 | $136,000 | $39,000 | $97,000 |
| 2018 | $880 | $120,000 | $36,000 | $84,000 |
| 2016 | $685 | $50,050 | $11,000 | $39,050 |
| 2015 | $667 | $45,925 | $11,000 | $34,925 |
| 2014 | $578 | $40,507 | $18,333 | $22,174 |
| 2013 | -- | $52,975 | $13,750 | $39,225 |
Source: Public Records
Map
Nearby Homes
- 1420 N Main St
- 282 E 1400 N
- 1260 N 200 W
- 1130 N 200 W
- 93 W 700 N
- 106 W 700 N
- 184 Park Shadows Cir
- 1410 N 200 W
- 967 S Courtyard Ln
- 96 Village Square Rd
- 951 Centerville Commons Way
- 235 W 1400 N
- 83 W 850 S
- 453 N 400 E Unit 7-D
- 16 W 780 S
- 610 E Pages Ln
- 563 N 200 W
- 499 N 200 W Unit 30
- 366 W 1000 N
- 345 N 400 E
- 127 E 1100 N
- 127 E 1100 N Unit 1
- 127 E 1100 N Unit 2
- 127 E 1100 N Unit 10
- 127 E 1100 N Unit 6
- 127 E 1100 N Unit 3
- 165 E 1100 N Unit 30
- 165 E 1100 N Unit 29
- 165 E 1100 N Unit 28
- 165 E 1100 N Unit 27
- 165 E 1100 N Unit 26
- 165 E 1100 N Unit 25
- 165 E 1100 N Unit 24
- 165 E 1100 N Unit 23
- 165 E 1100 N Unit 22
- 165 E 1100 N Unit 20
- 165 E 1100 N Unit 19
- 165 E 1100 N
- 165 E 1100 N Unit 17
- 165 E 1100 N Unit 16
Your Personal Tour Guide
Ask me questions while you tour the home.