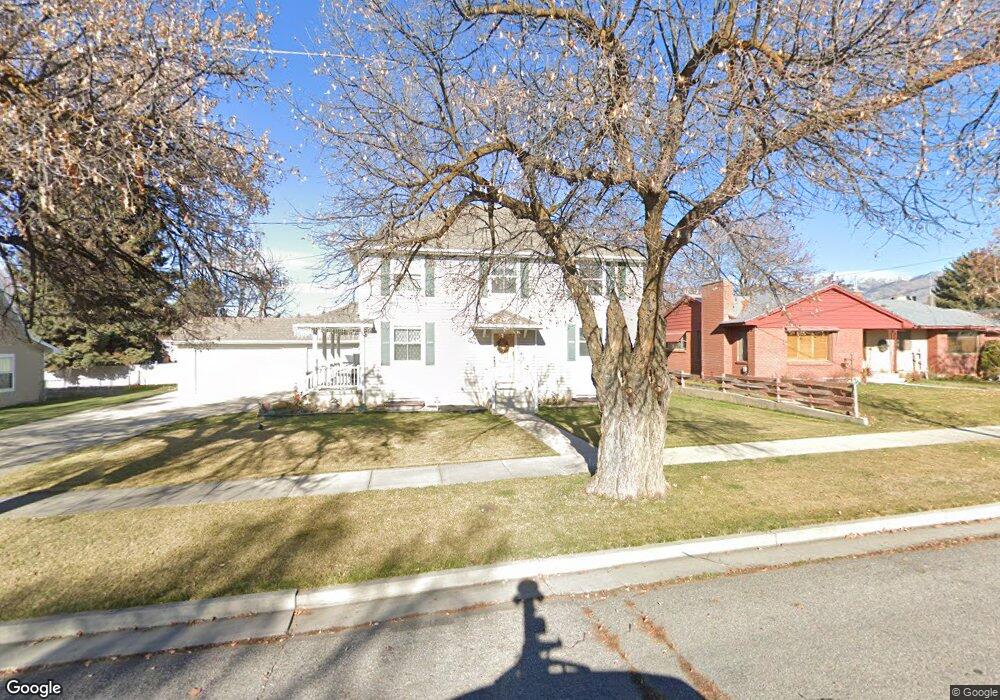
127 E 200 N Smithfield, UT 84335
Estimated Value: $555,000 - $608,000
5
Beds
4
Baths
3,416
Sq Ft
$172/Sq Ft
Est. Value
About This Home
This home is located at 127 E 200 N, Smithfield, UT 84335 and is currently estimated at $586,529, approximately $171 per square foot. 127 E 200 N is a home located in Cache County with nearby schools including Summit School, North Cache Middle School, and White Pine Middle School.
Ownership History
Date
Name
Owned For
Owner Type
Purchase Details
Closed on
Nov 15, 2017
Sold by
Sun Youping
Bought by
Sun Youping and Chen Qian
Current Estimated Value
Home Financials for this Owner
Home Financials are based on the most recent Mortgage that was taken out on this home.
Original Mortgage
$200,000
Outstanding Balance
$138,653
Interest Rate
3.88%
Mortgage Type
New Conventional
Estimated Equity
$447,876
Purchase Details
Closed on
Mar 7, 2013
Sold by
Erickson Morgan D
Bought by
Erickson Kevin
Purchase Details
Closed on
Sep 29, 2011
Sold by
Erickson Kevin
Bought by
Erickson Kevin and Erickson Morgan D
Home Financials for this Owner
Home Financials are based on the most recent Mortgage that was taken out on this home.
Original Mortgage
$242,687
Interest Rate
4.4%
Mortgage Type
FHA
Create a Home Valuation Report for This Property
The Home Valuation Report is an in-depth analysis detailing your home's value as well as a comparison with similar homes in the area
Home Values in the Area
Average Home Value in this Area
Purchase History
| Date | Buyer | Sale Price | Title Company |
|---|---|---|---|
| Sun Youping | -- | -- | |
| Sun Youping | -- | Northern Titie | |
| Erickson Kevin | -- | Northern Title Company | |
| Erickson Kevin | -- | Northern Title Company | |
| Erickson Kevin | -- | Northern Title Company |
Source: Public Records
Mortgage History
| Date | Status | Borrower | Loan Amount |
|---|---|---|---|
| Open | Sun Youping | $200,000 | |
| Closed | Sun Youping | $200,000 | |
| Previous Owner | Erickson Kevin | $242,687 |
Source: Public Records
Tax History
| Year | Tax Paid | Tax Assessment Tax Assessment Total Assessment is a certain percentage of the fair market value that is determined by local assessors to be the total taxable value of land and additions on the property. | Land | Improvement |
|---|---|---|---|---|
| 2025 | $247 | $330,870 | $0 | $0 |
| 2024 | $2,460 | $308,975 | $0 | $0 |
| 2023 | $2,586 | $307,120 | $0 | $0 |
| 2022 | $2,628 | $307,120 | $0 | $0 |
| 2021 | $2,123 | $379,006 | $73,500 | $305,506 |
| 2020 | $2,037 | $339,158 | $73,500 | $265,658 |
| 2019 | $1,950 | $309,608 | $43,950 | $265,658 |
| 2018 | $1,831 | $281,145 | $43,950 | $237,195 |
| 2017 | $1,770 | $148,420 | $0 | $0 |
| 2016 | $1,801 | $131,600 | $0 | $0 |
| 2015 | $1,603 | $131,600 | $0 | $0 |
| 2014 | $1,572 | $131,595 | $0 | $0 |
| 2013 | -- | $131,595 | $0 | $0 |
Source: Public Records
Map
Nearby Homes
Your Personal Tour Guide
Ask me questions while you tour the home.