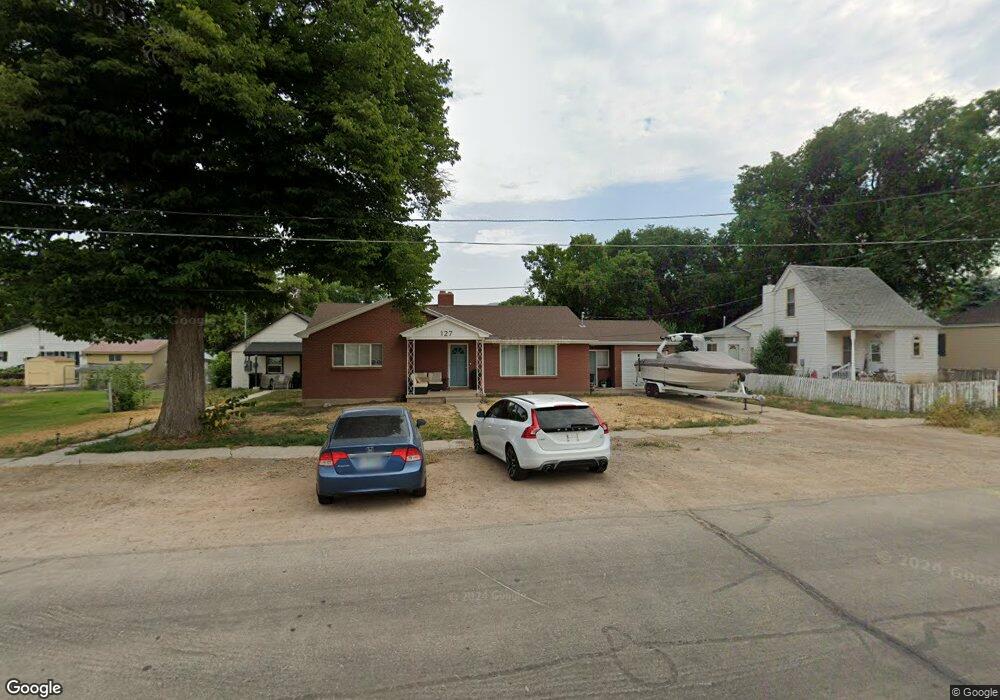
127 E 300 N Heber City, UT 84032
Estimated Value: $499,000 - $742,084
Studio
--
Bath
624
Sq Ft
$988/Sq Ft
Est. Value
About This Home
This home is located at 127 E 300 N, Heber City, UT 84032 and is currently estimated at $616,271, approximately $987 per square foot. 127 E 300 N is a home with nearby schools including J.R. Smith Elementary School and Wasatch High School.
Ownership History
Date
Name
Owned For
Owner Type
Purchase Details
Closed on
Nov 2, 2021
Sold by
Clyde Neal J and Clyde Connie G
Bought by
Robbins Heatherlee
Current Estimated Value
Home Financials for this Owner
Home Financials are based on the most recent Mortgage that was taken out on this home.
Original Mortgage
$570,000
Outstanding Balance
$521,503
Interest Rate
2.88%
Mortgage Type
New Conventional
Estimated Equity
$94,768
Purchase Details
Closed on
Jan 17, 2018
Sold by
Clyde Neal J and Clyde Connie
Bought by
Clyde Neal J and Clyde Connie G
Create a Home Valuation Report for This Property
The Home Valuation Report is an in-depth analysis detailing your home's value as well as a comparison with similar homes in the area
Home Values in the Area
Average Home Value in this Area
Purchase History
| Date | Buyer | Sale Price | Title Company |
|---|---|---|---|
| Robbins Heatherlee | -- | First American Heber City | |
| Clyde Neal J | -- | None Available |
Source: Public Records
Mortgage History
| Date | Status | Borrower | Loan Amount |
|---|---|---|---|
| Open | Robbins Heatherlee | $570,000 |
Source: Public Records
Tax History
| Year | Tax Paid | Tax Assessment Tax Assessment Total Assessment is a certain percentage of the fair market value that is determined by local assessors to be the total taxable value of land and additions on the property. | Land | Improvement |
|---|---|---|---|---|
| 2025 | $6,384 | $685,310 | $240,000 | $445,310 |
| 2024 | $5,559 | $600,880 | $240,000 | $360,880 |
| 2023 | $5,559 | $598,875 | $125,000 | $473,875 |
| 2022 | $6,059 | $598,875 | $125,000 | $473,875 |
| 2021 | $3,314 | $473,159 | $114,000 | $359,159 |
| 2020 | $3,089 | $429,372 | $125,000 | $304,372 |
| 2019 | $2,756 | $222,405 | $0 | $0 |
| 2018 | $2,137 | $172,504 | $0 | $0 |
| 2017 | $1,872 | $150,230 | $0 | $0 |
| 2016 | $1,748 | $136,578 | $0 | $0 |
| 2015 | $1,357 | $111,195 | $0 | $0 |
| 2014 | $1,369 | $111,195 | $0 | $0 |
Source: Public Records
Map
Nearby Homes
Your Personal Tour Guide
Ask me questions while you tour the home.