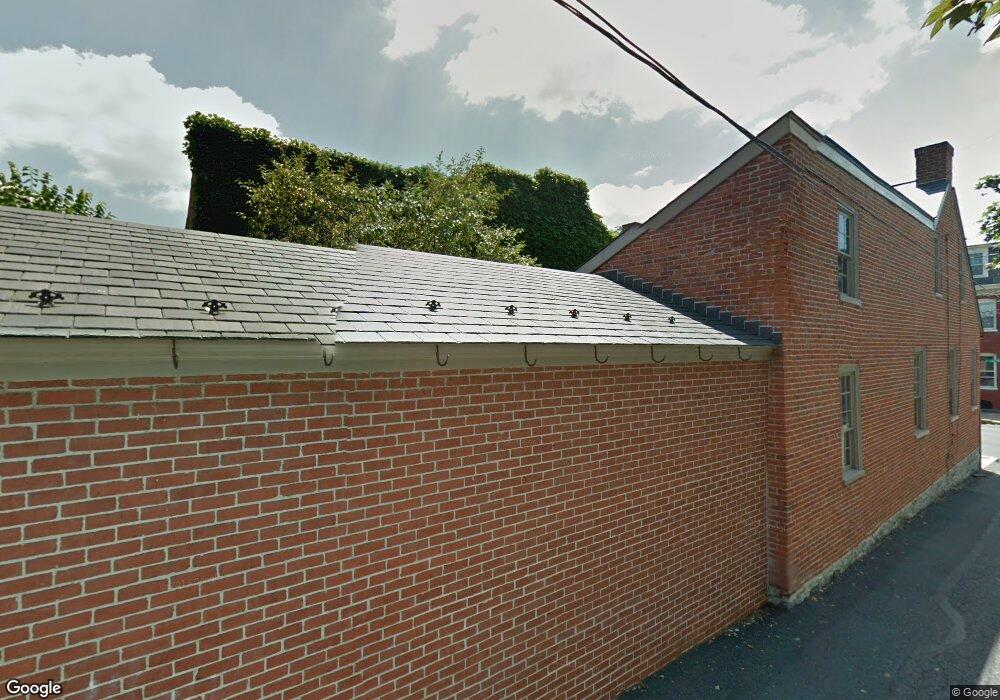
127 E Chestnut St Lancaster, PA 17602
Musser Park NeighborhoodEstimated Value: $368,000 - $503,000
3
Beds
2
Baths
2,472
Sq Ft
$183/Sq Ft
Est. Value
About This Home
This home is located at 127 E Chestnut St, Lancaster, PA 17602 and is currently estimated at $452,747, approximately $183 per square foot. 127 E Chestnut St is a home located in Lancaster County with nearby schools including Fulton El School, Reynolds Middle School, and McCaskey High School.
Ownership History
Date
Name
Owned For
Owner Type
Purchase Details
Closed on
Oct 27, 2016
Sold by
Charlan Group Lp
Bought by
Rowen Michael J and Fink Molly S
Current Estimated Value
Purchase Details
Closed on
Mar 25, 2002
Sold by
Kelly John B and Kelly Mary L
Bought by
Charlan Group Lp
Home Financials for this Owner
Home Financials are based on the most recent Mortgage that was taken out on this home.
Original Mortgage
$55,000
Interest Rate
6.88%
Mortgage Type
Seller Take Back
Create a Home Valuation Report for This Property
The Home Valuation Report is an in-depth analysis detailing your home's value as well as a comparison with similar homes in the area
Home Values in the Area
Average Home Value in this Area
Purchase History
| Date | Buyer | Sale Price | Title Company |
|---|---|---|---|
| Rowen Michael J | $250,000 | Attorney | |
| Charlan Group Lp | $125,000 | -- |
Source: Public Records
Mortgage History
| Date | Status | Borrower | Loan Amount |
|---|---|---|---|
| Previous Owner | Charlan Group Lp | $55,000 |
Source: Public Records
Tax History
| Year | Tax Paid | Tax Assessment Tax Assessment Total Assessment is a certain percentage of the fair market value that is determined by local assessors to be the total taxable value of land and additions on the property. | Land | Improvement |
|---|---|---|---|---|
| 2025 | $10,359 | $261,800 | $38,600 | $223,200 |
| 2024 | $10,359 | $261,800 | $38,600 | $223,200 |
| 2023 | $10,185 | $261,800 | $38,600 | $223,200 |
| 2022 | $9,761 | $261,800 | $38,600 | $223,200 |
| 2021 | $8,603 | $235,800 | $38,600 | $197,200 |
| 2020 | $8,603 | $235,800 | $38,600 | $197,200 |
| 2019 | $8,474 | $235,800 | $38,600 | $197,200 |
| 2018 | $4,592 | $235,800 | $38,600 | $197,200 |
| 2017 | $6,582 | $143,300 | $22,400 | $120,900 |
| 2016 | $6,522 | $143,300 | $22,400 | $120,900 |
| 2015 | $2,544 | $143,300 | $22,400 | $120,900 |
| 2014 | $5,692 | $143,300 | $22,400 | $120,900 |
Source: Public Records
Map
Nearby Homes
- 101 N Queen St Unit 412
- 101 N Queen St Unit 407
- 101 N Queen St Unit 414
- 101 N Queen St Unit 404
- 218 E Madison St
- 226 E Lemon St
- 145 E King St Unit 401
- 123 E King St
- 312 E Orange St
- 138 N Plum St
- 345 E Orange St
- 128 E James St
- 14 S Queen St
- 110 W Orange St
- 14 W James St
- 440 1/2 N Water St
- 139 S Duke St
- 522 E Orange St
- 305 W Lemon St
- 14 E Farnum St
- 131 E Chestnut St
- 125 E Chestnut St
- 123 E Chestnut St
- 119 E Chestnut St Unit 1ST FLOOR
- 119 E Chestnut St
- 121 E Chestnut St
- 121 E Chestnut St Unit 1ST FLOOR
- 119 121 E Chestnut St
- 139 E Chestnut St
- 117 E Chestnut St
- 115 E Chestnut St
- 141 E Chestnut St
- 134 E Chestnut St
- 111 E Chestnut St
- 124 E Chestnut St
- 132 E Chestnut St
- 221 N Cherry St
- 145 E Chestnut St
- 126 E Chestnut St
- 120 E Chestnut St
Your Personal Tour Guide
Ask me questions while you tour the home.