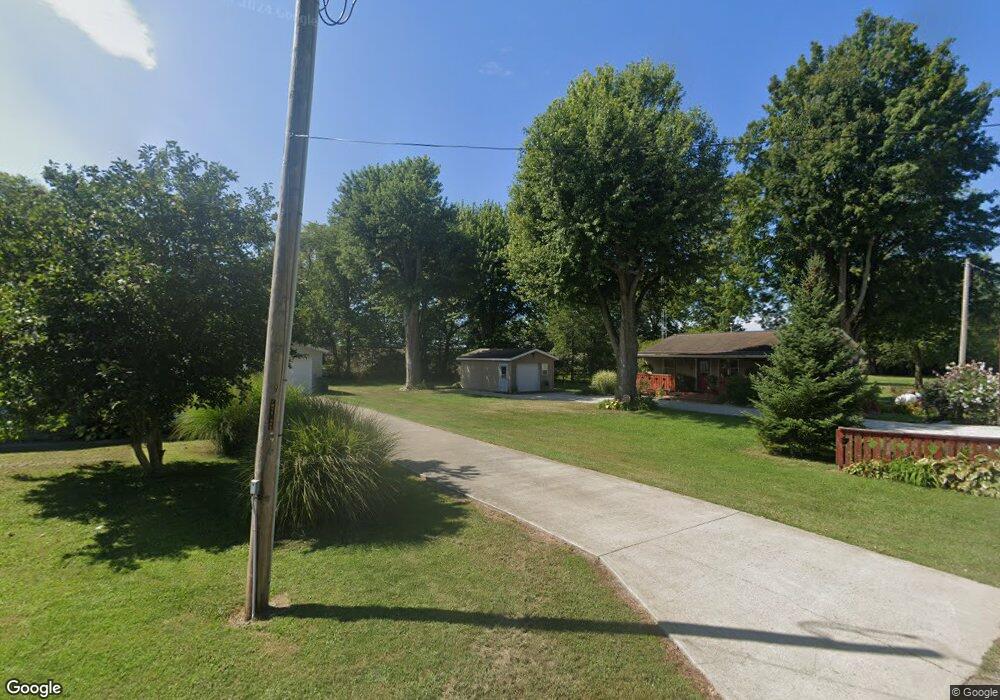
127 E Elm St Greens Fork, IN 47345
Estimated Value: $120,000 - $162,622
3
Beds
1
Bath
816
Sq Ft
$183/Sq Ft
Est. Value
About This Home
This home is located at 127 E Elm St, Greens Fork, IN 47345 and is currently estimated at $149,406, approximately $183 per square foot. 127 E Elm St is a home with nearby schools including Hagerstown Elementary School, Hagerstown Junior/Senior High School, and Shady Maple School.
Ownership History
Date
Name
Owned For
Owner Type
Purchase Details
Closed on
Sep 14, 2022
Sold by
William Tandy
Bought by
Tandy William G and Tandy Sheri L
Current Estimated Value
Purchase Details
Closed on
Nov 19, 2012
Sold by
Federal Home Loan Mortgage Corporation
Bought by
Tandy William
Home Financials for this Owner
Home Financials are based on the most recent Mortgage that was taken out on this home.
Original Mortgage
$25,918
Interest Rate
3.35%
Mortgage Type
New Conventional
Purchase Details
Closed on
May 30, 2012
Sold by
Lahman Beth
Bought by
Federal Home Loan Mortgage Corporation
Purchase Details
Closed on
Mar 1, 2007
Sold by
Thompson James C
Bought by
Lahman Beth
Home Financials for this Owner
Home Financials are based on the most recent Mortgage that was taken out on this home.
Original Mortgage
$69,995
Interest Rate
6.28%
Mortgage Type
New Conventional
Create a Home Valuation Report for This Property
The Home Valuation Report is an in-depth analysis detailing your home's value as well as a comparison with similar homes in the area
Purchase History
| Date | Buyer | Sale Price | Title Company |
|---|---|---|---|
| Tandy William G | -- | -- | |
| Tandy William | -- | None Available | |
| Federal Home Loan Mortgage Corporation | $55,000 | None Available | |
| Lahman Beth | -- | -- |
Source: Public Records
Mortgage History
| Date | Status | Borrower | Loan Amount |
|---|---|---|---|
| Previous Owner | Tandy William | $25,918 | |
| Previous Owner | Lahman Beth | $69,995 |
Source: Public Records
Tax History
| Year | Tax Paid | Tax Assessment Tax Assessment Total Assessment is a certain percentage of the fair market value that is determined by local assessors to be the total taxable value of land and additions on the property. | Land | Improvement |
|---|---|---|---|---|
| 2025 | $1,037 | $120,200 | $13,100 | $107,100 |
| 2024 | $1,037 | $103,700 | $11,300 | $92,400 |
| 2023 | $12 | $95,600 | $10,300 | $85,300 |
| 2022 | $1,225 | $95,800 | $10,300 | $85,500 |
| 2021 | $593 | $57,100 | $2,900 | $54,200 |
| 2020 | $577 | $57,200 | $3,400 | $53,800 |
| 2019 | $534 | $55,900 | $3,400 | $52,500 |
| 2018 | $473 | $59,200 | $3,400 | $55,800 |
| 2017 | $913 | $74,300 | $3,400 | $70,900 |
| 2016 | $435 | $56,200 | $3,400 | $52,800 |
| 2014 | $390 | $53,800 | $3,400 | $50,400 |
| 2013 | $390 | $49,500 | $3,400 | $46,100 |
Source: Public Records
Map
Nearby Homes
- 314 S Main St
- 10422 State Road 38
- 5226 Sugar Grove Rd
- 6027 State Road 38
- 4839 King Rd
- 5159 State Road 38
- 8961 College Corner Rd
- 8171 George Early Rd
- 6855 N Centerville Rd
- 9004 Hidden Hills Dr
- 0 Gaar Jackson Rd
- 4113 N Round Barn Rd
- 541 N Centerville Rd
- 1722 N Jacksonburg Rd
- 207 College Corner Rd
- 2620 Bryant Dr
- 8620 Sugar Grove Rd
- 6049 U S 35
- 7840 N Jacksonburg Rd
- 502 N 1st St
Your Personal Tour Guide
Ask me questions while you tour the home.