
Seller's Agent in 2025
Kelly Hayes
Samson Properties
(571) 259-6626
1 in this area
69 Total Sales
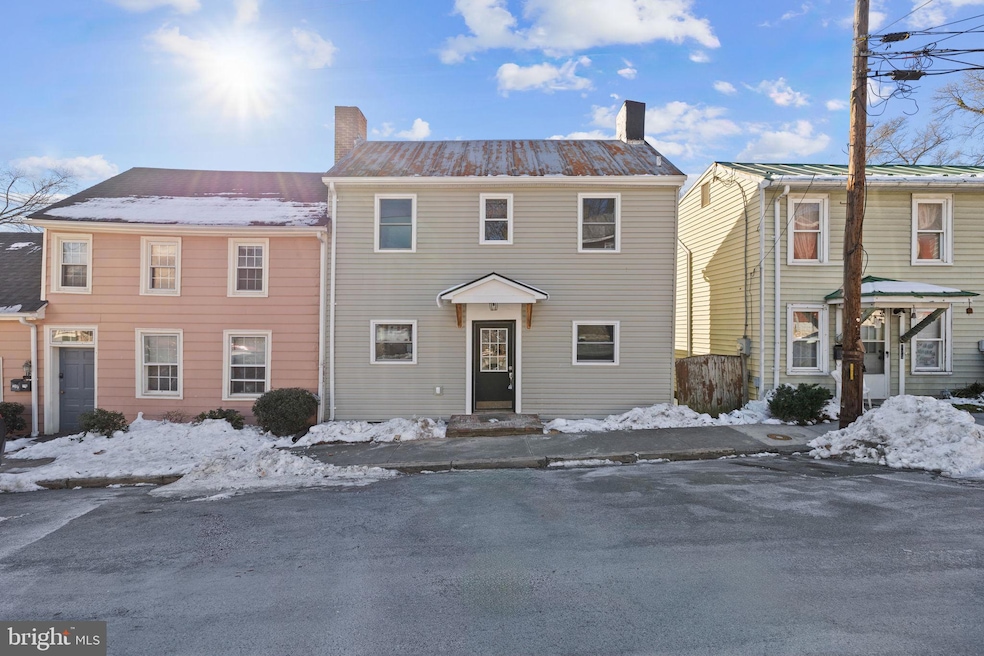
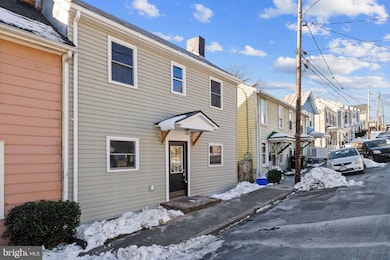
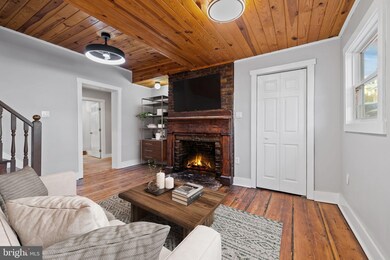
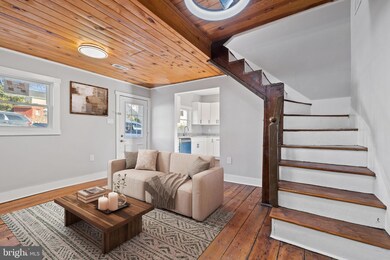
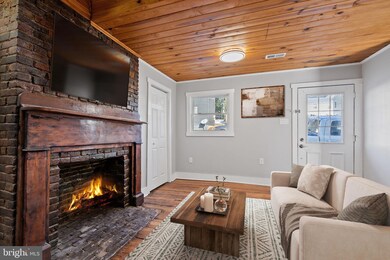
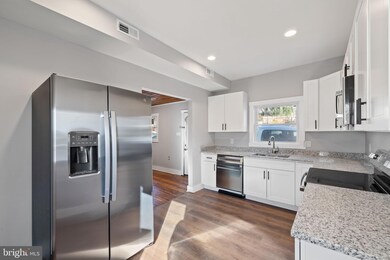
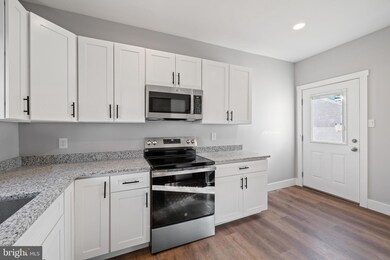
At no fault of the seller this beauty is back on the market!!!!This stunningly renovated home in the heart of Winchester City, VA blends timeless antique charm with luxurious modern upgrades. From the moment you step inside, you'll notice the fresh paint and restored original details, including gleaming hardwood floors. A few modern touches that have been added are a brand new HVAC system has been installed, and on suite laundry. All renovations have been done with care to preserved and honor the home's history.Located in the heart of Winchester City, this home offers the perfect mix of historical charm and modern convenience, with easy access to local shops, restaurants, and major highways.This house comes with a REDUCED RATE as low as 5.125% (APR 5.499%) as of 02/27/2025 through List & Lock. This is a SELLER PAID rate-buydown that reduces the buyer’s interest rate and monthly payment. Terms apply, see disclosures for more information.
Last Agent to Sell the Property
(571) 259-6626 kellyhayesrealtor@gmail.com Samson Properties Listed on: 01/18/2025
Last Buyer's Agent
(540) 974-1827 amanda@rocksolid-realestate.com Keller Williams Realty License #0225233417
| Date | Type | Sale Price | Title Company |
|---|---|---|---|
| Deed | $283,000 | Wfg National Title | |
| Deed | $40,000 | None Available |
| Date | Status | Loan Amount | Loan Type |
|---|---|---|---|
| Open | $259,157 | FHA | |
| Previous Owner | $1,425,000 | Commercial | |
| Previous Owner | $208,800 | Credit Line Revolving | |
| Previous Owner | $185,000 | Credit Line Revolving | |
| Previous Owner | $150,000 | Credit Line Revolving | |
| Previous Owner | $165,000 | Purchase Money Mortgage |
| Date | Event | Price | Change | Sq Ft Price |
|---|---|---|---|---|
| 05/19/2025 05/19/25 | Sold | $283,000 | -2.1% | $249 / Sq Ft |
| 04/18/2025 04/18/25 | Price Changed | $289,000 | -3.3% | $255 / Sq Ft |
| 03/28/2025 03/28/25 | Price Changed | $299,000 | -3.2% | $263 / Sq Ft |
| 03/12/2025 03/12/25 | Price Changed | $309,000 | -3.1% | $272 / Sq Ft |
| 03/08/2025 03/08/25 | Price Changed | $319,000 | -3.0% | $281 / Sq Ft |
| 01/18/2025 01/18/25 | For Sale | $329,000 | +117.0% | $290 / Sq Ft |
| 05/11/2023 05/11/23 | Sold | $151,580 | +19.4% | $157 / Sq Ft |
| 03/29/2023 03/29/23 | Pending | -- | -- | -- |
| 03/23/2023 03/23/23 | Price Changed | $127,000 | +6.7% | $131 / Sq Ft |
| 03/23/2023 03/23/23 | Price Changed | $119,000 | +12.3% | $123 / Sq Ft |
| 03/23/2023 03/23/23 | Price Changed | $106,000 | +30.9% | $110 / Sq Ft |
| 03/22/2023 03/22/23 | Price Changed | $81,000 | +5.2% | $84 / Sq Ft |
| 03/21/2023 03/21/23 | Price Changed | $77,000 | +6.9% | $80 / Sq Ft |
| 03/21/2023 03/21/23 | Price Changed | $72,000 | +1.4% | $74 / Sq Ft |
| 03/20/2023 03/20/23 | Price Changed | $71,000 | +2.9% | $73 / Sq Ft |
| 03/19/2023 03/19/23 | Price Changed | $69,000 | +1.5% | $71 / Sq Ft |
| 03/18/2023 03/18/23 | Price Changed | $68,000 | +4.6% | $70 / Sq Ft |
| 03/16/2023 03/16/23 | Price Changed | $65,000 | +3.2% | $67 / Sq Ft |
| 03/15/2023 03/15/23 | Price Changed | $63,000 | +10.5% | $65 / Sq Ft |
| 03/14/2023 03/14/23 | Price Changed | $57,000 | +14.0% | $59 / Sq Ft |
| 03/13/2023 03/13/23 | Price Changed | $50,000 | +13.6% | $52 / Sq Ft |
| 03/12/2023 03/12/23 | Price Changed | $44,000 | +12.8% | $46 / Sq Ft |
| 03/12/2023 03/12/23 | Price Changed | $39,000 | +2.6% | $40 / Sq Ft |
| 03/11/2023 03/11/23 | Price Changed | $38,000 | +2.7% | $39 / Sq Ft |
| 03/11/2023 03/11/23 | Price Changed | $37,000 | +362.5% | $38 / Sq Ft |
| 03/10/2023 03/10/23 | Price Changed | $8,000 | +300.0% | $8 / Sq Ft |
| 03/09/2023 03/09/23 | Price Changed | $2,000 | +100.0% | $2 / Sq Ft |
| 03/09/2023 03/09/23 | For Sale | $1,000 | -- | $1 / Sq Ft |
| Year | Tax Paid | Tax Assessment Tax Assessment Total Assessment is a certain percentage of the fair market value that is determined by local assessors to be the total taxable value of land and additions on the property. | Land | Improvement |
|---|---|---|---|---|
| 2025 | -- | $164,300 | $35,000 | $129,300 |
| 2024 | $1,216 | $146,500 | $35,000 | $111,500 |
| 2023 | $1,216 | $146,500 | $35,000 | $111,500 |
| 2022 | $1,039 | $111,700 | $35,000 | $76,700 |
| 2021 | $1,039 | $111,700 | $35,000 | $76,700 |
| 2020 | $1,006 | $108,200 | $35,000 | $73,200 |
| 2019 | $1,006 | $108,200 | $35,000 | $73,200 |
| 2018 | $954 | $104,800 | $35,000 | $69,800 |
| 2017 | $954 | $104,800 | $35,000 | $69,800 |
| 2016 | $954 | $104,800 | $35,000 | $69,800 |
| 2015 | $954 | $104,800 | $35,000 | $69,800 |
| 2014 | $901 | $94,800 | $35,000 | $59,800 |
Seller's Agent in 2025
Kelly Hayes
Samson Properties
(571) 259-6626
1 in this area
69 Total Sales
Buyer's Agent in 2025
Amanda Slate
Keller Williams Realty
(540) 974-1827
24 in this area
139 Total Sales
A
Seller's Agent in 2023
Alex Sharp
Thornton River. LLC
(540) 219-4425
7 in this area
29 Total Sales
Source: Bright MLS
MLS Number: VAWI2006500
APN: 213-01-H-16
Disclaimer: Certain information contained herein is derived from information provided by parties other than Homes.com. All information provided is deemed reliable, but is not guaranteed to be accurate and should be independently verified.
![]() The data relating to real estate for sale on this website appears in part through the BRIGHT Internet Data Exchange program, a voluntary cooperative exchange of property listing data between licensed real estate brokerage firms, and is provided by BRIGHT through a licensing agreement.
The data relating to real estate for sale on this website appears in part through the BRIGHT Internet Data Exchange program, a voluntary cooperative exchange of property listing data between licensed real estate brokerage firms, and is provided by BRIGHT through a licensing agreement.
Listing information is from various brokers who participate in the Bright MLS IDX program and not all listings may be visible on the site.
The property information being provided on or through the website is for the personal, non-commercial use of consumers and such information may not be used for any purpose other than to identify prospective properties consumers may be interested in purchasing.
Some properties which appear for sale on the website may no longer be available because they are for instance, under contract, sold or are no longer being offered for sale.
Property information displayed is deemed reliable but is not guaranteed.
Copyright 2025 Bright MLS, Inc.