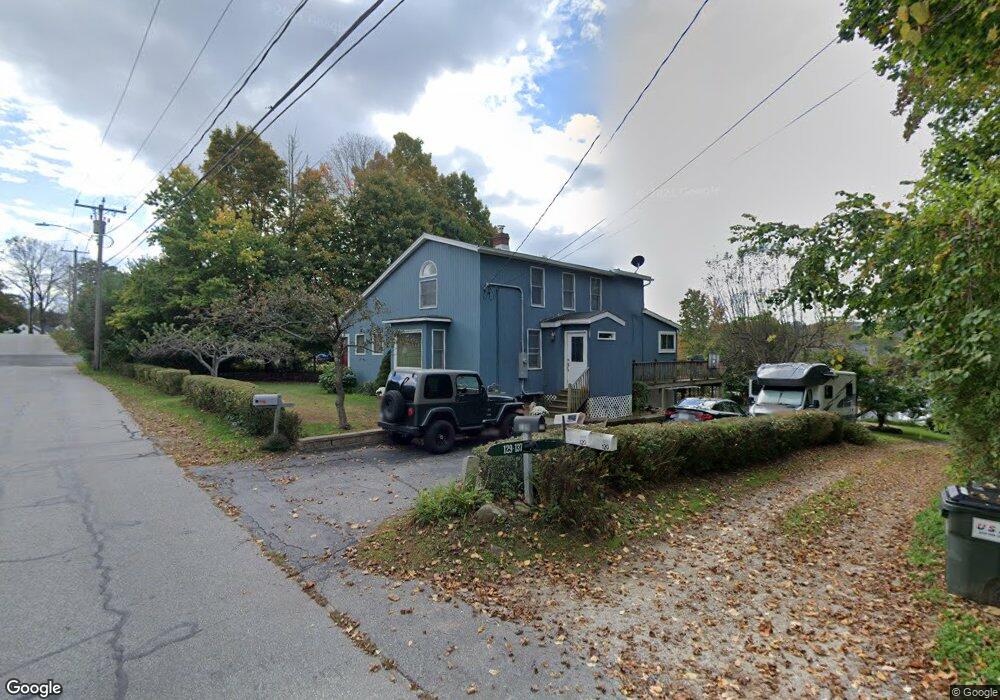
127 E Lake St Winsted, CT 06098
Estimated Value: $255,000 - $423,000
3
Beds
2
Baths
1,730
Sq Ft
$206/Sq Ft
Est. Value
About This Home
This home is located at 127 E Lake St, Winsted, CT 06098 and is currently estimated at $356,019, approximately $205 per square foot. 127 E Lake St is a home located in Litchfield County with nearby schools including Pearson School, Explorations Charter School, and St Anthony School.
Ownership History
Date
Name
Owned For
Owner Type
Purchase Details
Closed on
Apr 19, 2002
Sold by
Lauzon Maria G
Bought by
Lauzon John M and Lauzon Charlotte
Current Estimated Value
Home Financials for this Owner
Home Financials are based on the most recent Mortgage that was taken out on this home.
Original Mortgage
$125,000
Outstanding Balance
$50,670
Interest Rate
6.5%
Estimated Equity
$305,349
Create a Home Valuation Report for This Property
The Home Valuation Report is an in-depth analysis detailing your home's value as well as a comparison with similar homes in the area
Home Values in the Area
Average Home Value in this Area
Purchase History
We collect this data history from publicly available records. To have your information removed, we recommend requesting removal directly through your county’s website.
| Date | Buyer | Sale Price | Title Company |
|---|---|---|---|
| Lauzon John M | $160,000 | -- | |
| Lauzon John M | $160,000 | -- |
Source: Public Records
Mortgage History
We collect this data history from publicly available records. To have your information removed, we recommend requesting removal directly through your county’s website.
| Date | Status | Borrower | Loan Amount |
|---|---|---|---|
| Open | Lauzon John M | $125,000 | |
| Closed | Lauzon John M | $125,000 | |
| Previous Owner | Lauzon John M | $115,000 | |
| Previous Owner | Lauzon John M | $115,000 |
Source: Public Records
Tax History
| Year | Tax Paid | Tax Assessment Tax Assessment Total Assessment is a certain percentage of the fair market value that is determined by local assessors to be the total taxable value of land and additions on the property. | Land | Improvement |
|---|---|---|---|---|
| 2025 | $6,953 | $238,350 | $120,750 | $117,600 |
| 2024 | $6,493 | $238,350 | $120,750 | $117,600 |
| 2023 | $6,244 | $236,600 | $120,750 | $115,850 |
| 2022 | $4,400 | $131,200 | $45,240 | $85,960 |
| 2021 | $4,400 | $131,200 | $45,240 | $85,960 |
| 2020 | $4,400 | $131,200 | $45,240 | $85,960 |
| 2019 | $4,400 | $131,200 | $45,240 | $85,960 |
| 2018 | $4,400 | $131,200 | $45,240 | $85,960 |
| 2017 | $3,968 | $118,310 | $37,950 | $80,360 |
| 2016 | $3,952 | $117,820 | $37,950 | $79,870 |
| 2015 | $3,853 | $117,820 | $37,950 | $79,870 |
| 2014 | $3,760 | $117,820 | $37,950 | $79,870 |
Source: Public Records
Map
Nearby Homes
- 129 E Lake St
- 124 Rockwell St
- 69 Prospect St
- 107 Birdsall St
- 147 E Wakefield Blvd
- 57 Bridge St
- 63 Meadow St
- 121 W Wakefield Blvd
- 51 Hinsdale Ave
- 118 Meadow St
- 30 Upland Rd
- 77 Hubbard St
- 258 Perch Rock Trail
- 99 Hubbard St
- 9 Loomis St
- 55 Walnut St
- 150 Oak St
- 57 Main St
- 424 E Wakefield Blvd
- 217 Walnut St
Your Personal Tour Guide
Ask me questions while you tour the home.