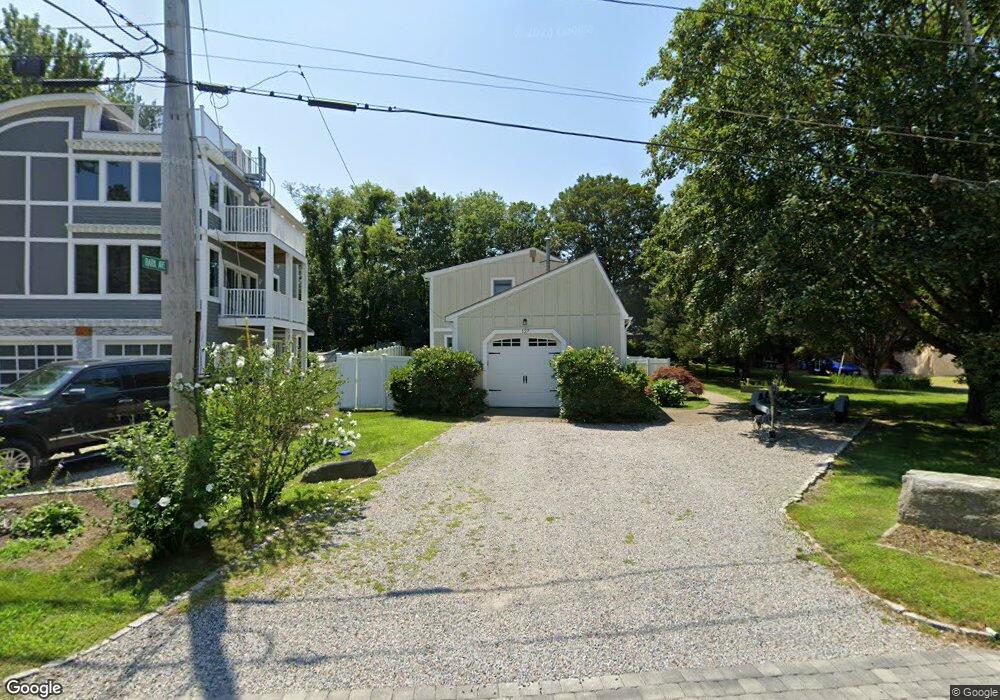
127 Frigate St Jamestown, RI 02835
Jamestown Shores NeighborhoodEstimated Value: $895,000 - $1,048,000
3
Beds
3
Baths
2,128
Sq Ft
$461/Sq Ft
Est. Value
About This Home
This home is located at 127 Frigate St, Jamestown, RI 02835 and is currently estimated at $980,716, approximately $460 per square foot. 127 Frigate St is a home located in Newport County with nearby schools including Melrose Avenue School and Lawn Avenue School.
Ownership History
Date
Name
Owned For
Owner Type
Purchase Details
Closed on
May 26, 2017
Sold by
Pages Michelle R and Pages Pierre M
Bought by
Petrarca Kristen M and Petrarca Jeffrey T
Current Estimated Value
Home Financials for this Owner
Home Financials are based on the most recent Mortgage that was taken out on this home.
Original Mortgage
$340,000
Outstanding Balance
$232,086
Interest Rate
4.08%
Mortgage Type
New Conventional
Estimated Equity
$748,630
Purchase Details
Closed on
Jul 6, 2009
Sold by
Costello Merrill P
Bought by
Pages Michelle R and Pages Pierre M
Create a Home Valuation Report for This Property
The Home Valuation Report is an in-depth analysis detailing your home's value as well as a comparison with similar homes in the area
Home Values in the Area
Average Home Value in this Area
Purchase History
| Date | Buyer | Sale Price | Title Company |
|---|---|---|---|
| Petrarca Kristen M | $425,000 | -- | |
| Pages Michelle R | $300,000 | -- |
Source: Public Records
Mortgage History
| Date | Status | Borrower | Loan Amount |
|---|---|---|---|
| Open | Petrarca Kristen M | $340,000 | |
| Previous Owner | Pages Michelle R | $54,500 | |
| Previous Owner | Pages Michelle R | $37,000 |
Source: Public Records
Tax History Compared to Growth
Tax History
| Year | Tax Paid | Tax Assessment Tax Assessment Total Assessment is a certain percentage of the fair market value that is determined by local assessors to be the total taxable value of land and additions on the property. | Land | Improvement |
|---|---|---|---|---|
| 2025 | $4,571 | $810,400 | $230,700 | $579,700 |
| 2024 | $4,157 | $579,800 | $174,700 | $405,100 |
| 2023 | $4,119 | $590,100 | $174,700 | $415,400 |
| 2022 | $4,245 | $625,200 | $174,700 | $450,500 |
| 2021 | $3,660 | $442,000 | $140,900 | $301,100 |
| 2020 | $3,567 | $442,000 | $140,900 | $301,100 |
| 2019 | $3,558 | $442,000 | $140,900 | $301,100 |
| 2018 | $2,990 | $337,900 | $125,800 | $212,100 |
| 2017 | $2,759 | $318,600 | $125,800 | $192,800 |
| 2016 | $2,734 | $318,600 | $125,800 | $192,800 |
| 2015 | $2,610 | $297,300 | $147,100 | $150,200 |
| 2014 | $2,601 | $297,300 | $147,100 | $150,200 |
Source: Public Records
Map
Nearby Homes
- 86 Spanker St
- 31 Stanchion St
- 58 Dolphin St
- 174 Seaside Dr
- 398 Sampan Ave
- 94 Spindrift St
- 625 N Main Rd
- 121 Seaside Dr
- 21 Helm St
- 280 W Reach Dr
- 27 Marcello Dr
- 10 Columbia Ln
- 10 Coulter St
- 18 Collins Terrace
- 50 Prospect Ave
- 12 Easterly Way
- 0 Circuit Ave
- 10 Highland Rd
- 41 Pierce Rd
- 16 Pennsylvania Ave