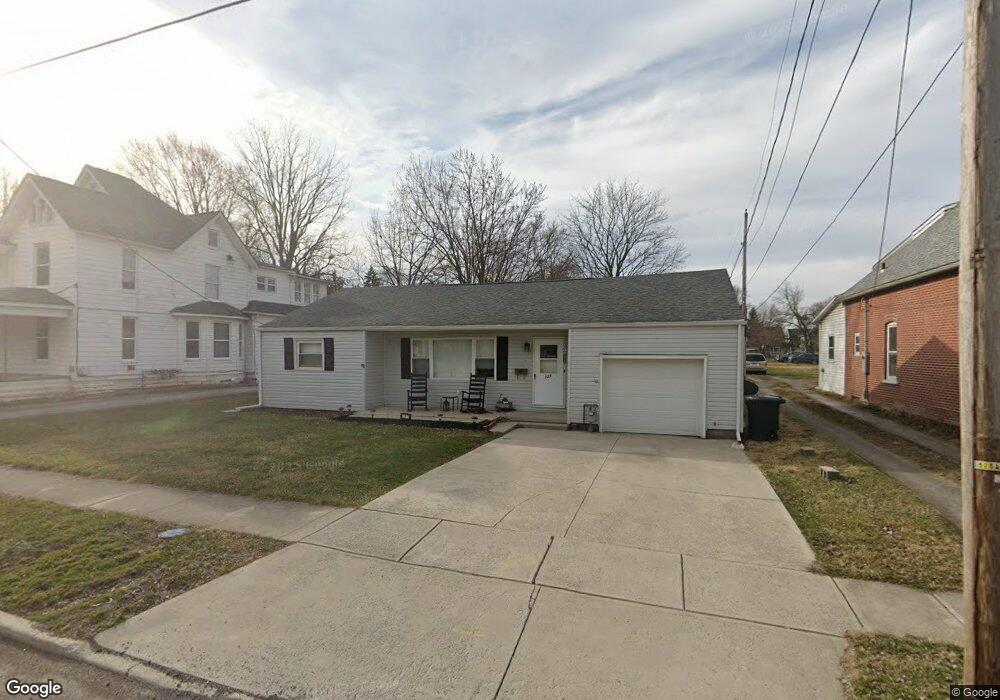
127 George St Findlay, OH 45840
Estimated Value: $107,000 - $141,000
2
Beds
2
Baths
1,132
Sq Ft
$109/Sq Ft
Est. Value
About This Home
This home is located at 127 George St, Findlay, OH 45840 and is currently estimated at $122,998, approximately $108 per square foot. 127 George St is a home located in Hancock County with nearby schools including Whittier Primary School, Bigelow Hill Elementary School, and Glenwood Middle School.
Ownership History
Date
Name
Owned For
Owner Type
Purchase Details
Closed on
Aug 1, 2024
Sold by
Holland Lisa
Bought by
Holland David R
Current Estimated Value
Purchase Details
Closed on
Dec 19, 2020
Sold by
Smith Michael L and Smith Pamela S
Bought by
Holland David and Holland Lisa
Home Financials for this Owner
Home Financials are based on the most recent Mortgage that was taken out on this home.
Original Mortgage
$71,250
Interest Rate
2.8%
Mortgage Type
New Conventional
Purchase Details
Closed on
Oct 15, 1991
Bought by
Smith Michael L and Smith Pamela S
Create a Home Valuation Report for This Property
The Home Valuation Report is an in-depth analysis detailing your home's value as well as a comparison with similar homes in the area
Home Values in the Area
Average Home Value in this Area
Purchase History
| Date | Buyer | Sale Price | Title Company |
|---|---|---|---|
| Holland David R | -- | None Listed On Document | |
| Holland David | $75,000 | Assured Title Agency | |
| Smith Michael L | $41,000 | -- |
Source: Public Records
Mortgage History
| Date | Status | Borrower | Loan Amount |
|---|---|---|---|
| Previous Owner | Holland David | $71,250 |
Source: Public Records
Tax History Compared to Growth
Tax History
| Year | Tax Paid | Tax Assessment Tax Assessment Total Assessment is a certain percentage of the fair market value that is determined by local assessors to be the total taxable value of land and additions on the property. | Land | Improvement |
|---|---|---|---|---|
| 2024 | $1,167 | $32,860 | $7,170 | $25,690 |
| 2023 | $1,169 | $32,860 | $7,170 | $25,690 |
| 2022 | $1,165 | $32,860 | $7,170 | $25,690 |
| 2021 | $1,071 | $26,320 | $7,170 | $19,150 |
| 2020 | $1,099 | $26,320 | $7,170 | $19,150 |
| 2019 | $1,078 | $26,320 | $7,170 | $19,150 |
| 2018 | $1,021 | $22,880 | $6,230 | $16,650 |
| 2017 | $1,022 | $22,880 | $6,230 | $16,650 |
| 2016 | $1,018 | $22,880 | $6,230 | $16,650 |
| 2015 | $1,162 | $25,840 | $6,230 | $19,610 |
| 2014 | $1,162 | $25,840 | $6,230 | $19,610 |
| 2012 | $1,171 | $25,840 | $6,230 | $19,610 |
Source: Public Records
Map
Nearby Homes
- 115 George St
- 206 Midland Ave
- 230 Midland Ave
- 207 Ash Ave
- 706 N Cory St
- 334 E Foulke Ave
- 247 Crystal Ave
- 420 Allen Ave
- 224 Defiance Ave
- 512 N Cory St
- 533 Davis St
- 1820 N Main St
- 1825 Pershing St
- 604 Davis St
- 524 Defiance Ave
- 410 Monroe Ave
- 405 Clifton Ave
- 213 Cherry St
- 304 Rector Ave
- 715 Christina Ct