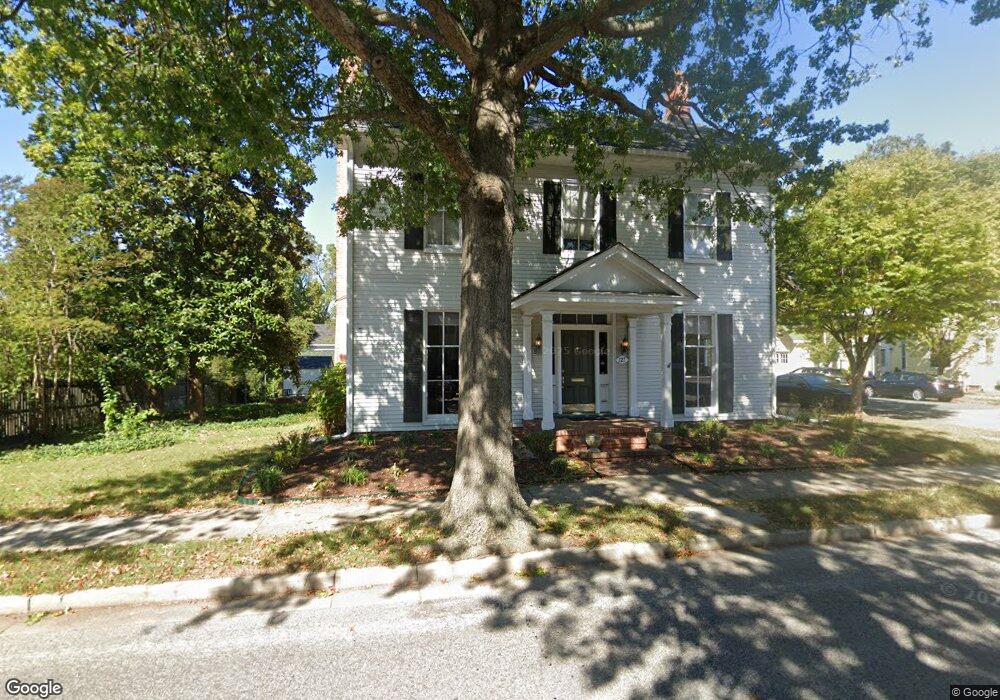
127 Goldsborough St Easton, MD 21601
Estimated Value: $437,000 - $704,000
6
Beds
5
Baths
2,668
Sq Ft
$202/Sq Ft
Est. Value
About This Home
This home is located at 127 Goldsborough St, Easton, MD 21601 and is currently estimated at $540,053, approximately $202 per square foot. 127 Goldsborough St is a home located in Talbot County with nearby schools including Easton Elementary School, Easton Middle School, and Easton High School.
Ownership History
Date
Name
Owned For
Owner Type
Purchase Details
Closed on
Jul 1, 2025
Sold by
Benitz John B and Benitz Maria D
Bought by
John And Maria Benitz 2008 Trust and Benitz
Current Estimated Value
Purchase Details
Closed on
Aug 15, 2014
Sold by
Benitz John B and Benitz Melvin D
Bought by
Benitz John B and Benitz Maria D
Home Financials for this Owner
Home Financials are based on the most recent Mortgage that was taken out on this home.
Original Mortgage
$210,000
Interest Rate
4.14%
Mortgage Type
New Conventional
Purchase Details
Closed on
Oct 2, 1996
Sold by
Benitz Melvin D
Bought by
Benitz Melvin D and Benitz John B
Purchase Details
Closed on
Mar 22, 1996
Sold by
Doerr Ann Hagemann
Bought by
Benitz Melvin D
Purchase Details
Closed on
Jun 29, 1993
Sold by
Stewart Harvey H and Stewart Carol C
Bought by
Doerr Ann Hagemann
Home Financials for this Owner
Home Financials are based on the most recent Mortgage that was taken out on this home.
Original Mortgage
$145,800
Interest Rate
7.34%
Create a Home Valuation Report for This Property
The Home Valuation Report is an in-depth analysis detailing your home's value as well as a comparison with similar homes in the area
Home Values in the Area
Average Home Value in this Area
Purchase History
| Date | Buyer | Sale Price | Title Company |
|---|---|---|---|
| John And Maria Benitz 2008 Trust | -- | None Listed On Document | |
| Benitz John B | -- | None Available | |
| Benitz Melvin D | -- | -- | |
| Benitz Melvin D | $156,000 | -- | |
| Doerr Ann Hagemann | $150,000 | -- |
Source: Public Records
Mortgage History
| Date | Status | Borrower | Loan Amount |
|---|---|---|---|
| Previous Owner | Benitz John B | $210,000 | |
| Previous Owner | Doerr Ann Hagemann | $145,800 | |
| Closed | Benitz Melvin D | -- |
Source: Public Records
Tax History Compared to Growth
Tax History
| Year | Tax Paid | Tax Assessment Tax Assessment Total Assessment is a certain percentage of the fair market value that is determined by local assessors to be the total taxable value of land and additions on the property. | Land | Improvement |
|---|---|---|---|---|
| 2025 | $2,635 | $363,333 | $0 | $0 |
| 2024 | $2,635 | $345,100 | $144,900 | $200,200 |
| 2023 | $2,472 | $345,100 | $144,900 | $200,200 |
| 2022 | $2,262 | $345,100 | $144,900 | $200,200 |
| 2021 | $2,277 | $361,200 | $166,200 | $195,000 |
| 2020 | $2,208 | $361,200 | $166,200 | $195,000 |
| 2019 | $2,208 | $361,200 | $166,200 | $195,000 |
| 2018 | $2,130 | $364,000 | $166,200 | $197,800 |
| 2017 | $2,000 | $363,733 | $0 | $0 |
| 2016 | $1,856 | $363,467 | $0 | $0 |
| 2015 | $1,500 | $363,200 | $0 | $0 |
| 2014 | $1,500 | $359,033 | $0 | $0 |
Source: Public Records
Map
Nearby Homes
- 13 N Thoroughgood Ln
- 12b Mistletoe Dr
- 133 N Washington St
- 26 S Washington St
- 33 S Harrison St
- 115 South St
- 418 North St
- 506 Goldsborough St
- 300 Dixon St Unit 303
- 300 Dixon St Unit 301
- 300 Dixon St Unit 307
- 300 Dixon St Unit 204
- 300 Dixon St Unit 202
- 30 Kelley Gibson St
- 11 Brookletts Ave
- 607 North St
- 295 Bay St Unit 7
- 295 Bay St Unit 4
- 328 N Washington St
- 10 N Park St
- 127 Goldsborough St Unit 2
- 127 Goldsborough St Unit 3
- 117 Goldsborough St
- 122 Goldsborough St
- 201 Goldsborough St
- 111 N Hanson St
- 120 Goldsborough St
- 111 Goldsborough St
- 116 Goldsborough St Unit Apartment 3
- 116 Goldsborough St
- 113 N Hanson St
- 118 Goldsborough St
- 112 N Hanson St
- 27 N Hanson St
- 200 Goldsborough St
- 205 Goldsborough St
- 114 Goldsborough St
- 25 N Hanson St
- 111 Turners Ln
- 109 Goldsborough St