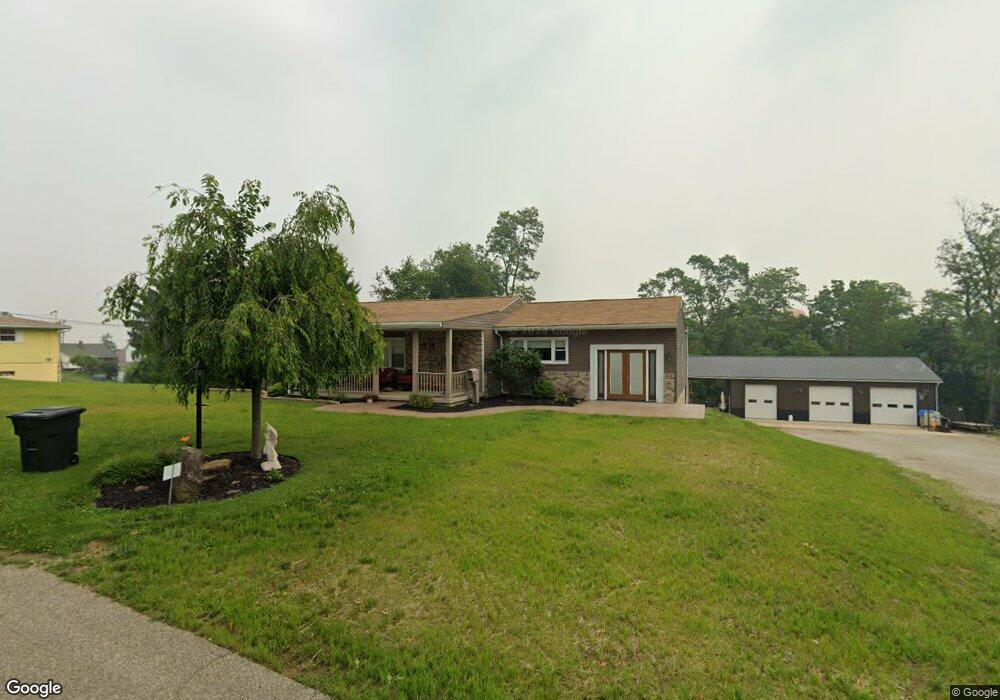
127 Grace Ave Barnesville, OH 43713
Estimated Value: $151,000 - $186,154
2
Beds
2
Baths
1,291
Sq Ft
$132/Sq Ft
Est. Value
About This Home
This home is located at 127 Grace Ave, Barnesville, OH 43713 and is currently estimated at $170,289, approximately $131 per square foot. 127 Grace Ave is a home located in Belmont County with nearby schools including Barnesville Elementary School, Barnesville Middle School, and Barnesville High School.
Ownership History
Date
Name
Owned For
Owner Type
Purchase Details
Closed on
Aug 31, 2006
Sold by
Anderson Shanna N and Kerner Shanna N
Bought by
Anderson Chris and Anderson Shanna
Current Estimated Value
Home Financials for this Owner
Home Financials are based on the most recent Mortgage that was taken out on this home.
Original Mortgage
$72,800
Outstanding Balance
$43,313
Interest Rate
6.5%
Mortgage Type
New Conventional
Estimated Equity
$126,976
Purchase Details
Closed on
Jun 30, 2004
Sold by
Price Roy W and Price Auddie M
Bought by
Kerner Shanna N
Purchase Details
Closed on
Jan 1, 1986
Sold by
Baker Virginia L
Bought by
Price Roy W and Price Auddie M
Create a Home Valuation Report for This Property
The Home Valuation Report is an in-depth analysis detailing your home's value as well as a comparison with similar homes in the area
Home Values in the Area
Average Home Value in this Area
Purchase History
| Date | Buyer | Sale Price | Title Company |
|---|---|---|---|
| Anderson Chris | -- | Old National Title | |
| Kerner Shanna N | $68,400 | -- | |
| Price Roy W | -- | -- |
Source: Public Records
Mortgage History
| Date | Status | Borrower | Loan Amount |
|---|---|---|---|
| Open | Anderson Chris | $72,800 |
Source: Public Records
Tax History Compared to Growth
Tax History
| Year | Tax Paid | Tax Assessment Tax Assessment Total Assessment is a certain percentage of the fair market value that is determined by local assessors to be the total taxable value of land and additions on the property. | Land | Improvement |
|---|---|---|---|---|
| 2024 | $1,700 | $51,310 | $5,330 | $45,980 |
| 2023 | $1,712 | $49,590 | $4,530 | $45,060 |
| 2022 | $1,711 | $49,585 | $4,529 | $45,056 |
| 2021 | $1,716 | $49,584 | $4,532 | $45,052 |
| 2020 | $1,058 | $29,230 | $3,780 | $25,450 |
| 2019 | $1,087 | $29,230 | $3,780 | $25,450 |
| 2018 | $1,054 | $29,230 | $3,780 | $25,450 |
| 2017 | $1,370 | $37,150 | $6,000 | $31,150 |
| 2016 | $1,284 | $37,150 | $6,000 | $31,150 |
| 2015 | $1,344 | $37,150 | $6,000 | $31,150 |
| 2014 | $1,133 | $30,980 | $5,450 | $25,530 |
| 2013 | $1,087 | $30,980 | $5,450 | $25,530 |
Source: Public Records
Map
Nearby Homes