Estimated Value: $309,559 - $524,000
--
Bed
--
Bath
1,208
Sq Ft
$377/Sq Ft
Est. Value
About This Home
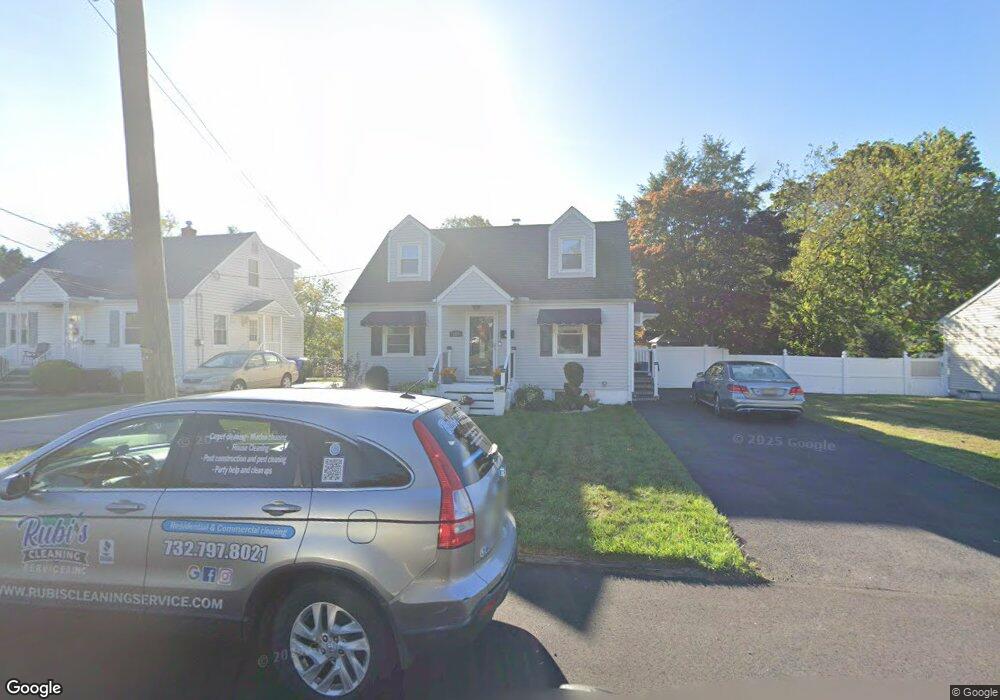
This home is located at 127 Grant Ave, Fords, NJ 08863 and is currently estimated at $455,140, approximately $376 per square foot. 127 Grant Ave is a home located in Middlesex County with nearby schools including Ford Avenue Elementary School, Fords Middle School, and Woodbridge High School.
Ownership History
Date
Name
Owned For
Owner Type
Purchase Details
Closed on
May 27, 1998
Sold by
Friga Helen
Bought by
Schanck Sidney
Current Estimated Value
Home Financials for this Owner
Home Financials are based on the most recent Mortgage that was taken out on this home.
Original Mortgage
$112,575
Interest Rate
6.94%
Create a Home Valuation Report for This Property
The Home Valuation Report is an in-depth analysis detailing your home's value as well as a comparison with similar homes in the area
Home Values in the Area
Average Home Value in this Area
Purchase History
| Date | Buyer | Sale Price | Title Company |
|---|---|---|---|
| Schanck Sidney | $118,500 | -- |
Source: Public Records
Mortgage History
| Date | Status | Borrower | Loan Amount |
|---|---|---|---|
| Previous Owner | Schanck Sidney | $112,575 |
Source: Public Records
Tax History Compared to Growth
Tax History
| Year | Tax Paid | Tax Assessment Tax Assessment Total Assessment is a certain percentage of the fair market value that is determined by local assessors to be the total taxable value of land and additions on the property. | Land | Improvement |
|---|---|---|---|---|
| 2025 | $8,725 | $69,100 | $21,700 | $47,400 |
| 2024 | $8,471 | $69,100 | $21,700 | $47,400 |
| 2023 | $8,471 | $69,100 | $21,700 | $47,400 |
| 2022 | $8,243 | $69,100 | $21,700 | $47,400 |
| 2021 | $8,152 | $69,100 | $21,700 | $47,400 |
| 2020 | $7,893 | $69,100 | $21,700 | $47,400 |
| 2019 | $6,477 | $58,200 | $21,700 | $36,500 |
| 2018 | $6,010 | $55,100 | $21,700 | $33,400 |
| 2017 | $5,905 | $55,100 | $21,700 | $33,400 |
| 2016 | $5,856 | $55,100 | $21,700 | $33,400 |
| 2015 | $5,742 | $55,100 | $21,700 | $33,400 |
| 2014 | $5,617 | $55,100 | $21,700 | $33,400 |
Source: Public Records
Map
Nearby Homes