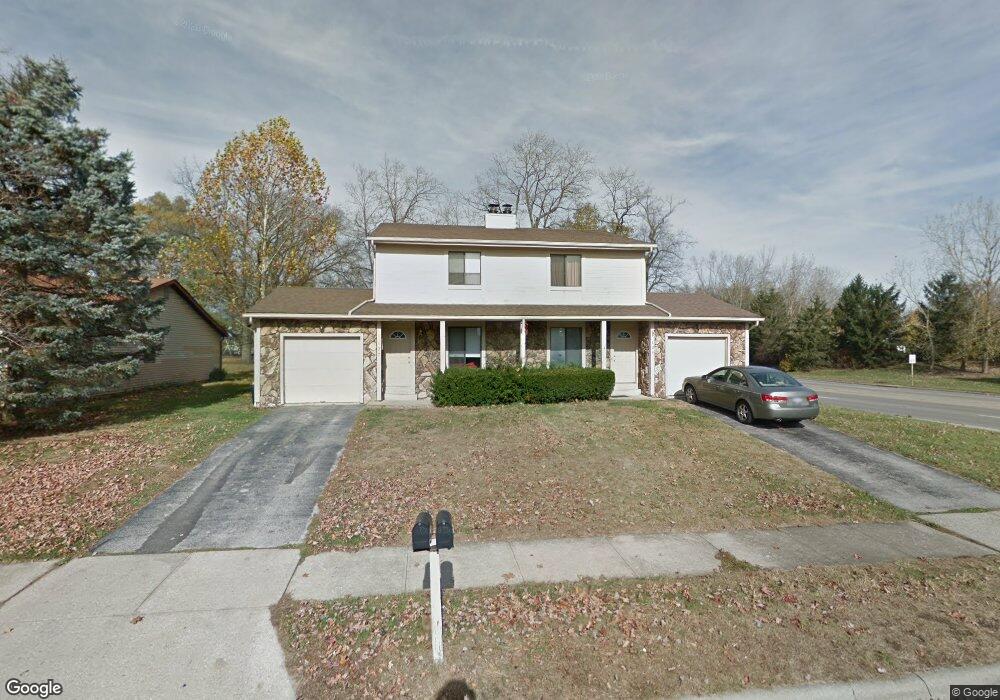
127 Groton Dr Unit 2 Westerville, OH 43081
Estimated Value: $370,665 - $440,000
4
Beds
2
Baths
2,046
Sq Ft
$201/Sq Ft
Est. Value
About This Home
This home is located at 127 Groton Dr Unit 2, Westerville, OH 43081 and is currently estimated at $412,166, approximately $201 per square foot. 127 Groton Dr Unit 2 is a home located in Franklin County with nearby schools including Annehurst Elementary School, Heritage Middle School, and Westerville South High School.
Ownership History
Date
Name
Owned For
Owner Type
Purchase Details
Closed on
Aug 21, 2015
Sold by
Stamos Nick M
Bought by
Wyman Austin and Wyman Kelsey
Current Estimated Value
Home Financials for this Owner
Home Financials are based on the most recent Mortgage that was taken out on this home.
Original Mortgage
$186,459
Outstanding Balance
$143,276
Interest Rate
3.37%
Mortgage Type
FHA
Estimated Equity
$268,890
Purchase Details
Closed on
Aug 15, 2002
Sold by
Ellis Maria E and Ellis Andrew
Bought by
Stamos Nick M
Home Financials for this Owner
Home Financials are based on the most recent Mortgage that was taken out on this home.
Original Mortgage
$170,000
Interest Rate
6.64%
Mortgage Type
Balloon
Purchase Details
Closed on
Oct 3, 1997
Sold by
Halley Ann E
Bought by
Quillen Maria E and Sabo Katherine M
Home Financials for this Owner
Home Financials are based on the most recent Mortgage that was taken out on this home.
Original Mortgage
$140,600
Interest Rate
7.7%
Purchase Details
Closed on
Jun 1, 1984
Create a Home Valuation Report for This Property
The Home Valuation Report is an in-depth analysis detailing your home's value as well as a comparison with similar homes in the area
Home Values in the Area
Average Home Value in this Area
Purchase History
| Date | Buyer | Sale Price | Title Company |
|---|---|---|---|
| Wyman Austin | $189,900 | Landsel Title | |
| Stamos Nick M | $170,000 | -- | |
| Quillen Maria E | $148,000 | Connor Title Co | |
| -- | $93,500 | -- |
Source: Public Records
Mortgage History
| Date | Status | Borrower | Loan Amount |
|---|---|---|---|
| Open | Wyman Austin | $186,459 | |
| Previous Owner | Stamos Nick M | $170,000 | |
| Previous Owner | Quillen Maria E | $140,600 |
Source: Public Records
Tax History Compared to Growth
Tax History
| Year | Tax Paid | Tax Assessment Tax Assessment Total Assessment is a certain percentage of the fair market value that is determined by local assessors to be the total taxable value of land and additions on the property. | Land | Improvement |
|---|---|---|---|---|
| 2024 | $5,030 | $86,450 | $24,500 | $61,950 |
| 2023 | $4,926 | $86,450 | $24,500 | $61,950 |
| 2022 | $5,882 | $78,830 | $18,730 | $60,100 |
| 2021 | $5,932 | $78,830 | $18,730 | $60,100 |
| 2020 | $5,915 | $78,830 | $18,730 | $60,100 |
| 2019 | $5,411 | $68,820 | $18,730 | $50,090 |
| 2018 | $5,366 | $68,820 | $18,730 | $50,090 |
| 2017 | $5,324 | $68,820 | $18,730 | $50,090 |
| 2016 | $5,522 | $64,960 | $19,460 | $45,500 |
| 2015 | $5,426 | $64,960 | $19,460 | $45,500 |
| 2014 | $5,430 | $64,960 | $19,460 | $45,500 |
| 2013 | $2,711 | $64,960 | $19,460 | $45,500 |
Source: Public Records
Map
Nearby Homes
- 658 River Trace
- 640 Glacier Pass
- 101 W Ticonderoga Dr Unit B
- 134 W Ticonderoga Dr Unit D
- 107 W Ticonderoga Dr Unit 3E
- 106 E Ticonderoga Dr
- 106 E Ticonderoga Dr Unit A
- 671 College Crest Rd
- 321 Pinnate Ln Unit Lot 1504
- 322 Pinnate Ln Unit Lot 1201
- 327 Pinnate Ln Unit Lot 1502
- 324 Pinnate Ln Unit Lot 1202
- 331 Pinnate Ln Unit Lot 1501
- 328 Pinnate Ln Unit Lot 1203
- 332 Pinnate Ln Unit Lot 1204
- 385 Hockberry Ave Unit Lot 1603
- 325 Vannette Ln Unit Lot 602
- Highwood Plan at Towns on the Greenway
- Halston with Loft Plan at Towns on the Greenway
- Halston Plan at Towns on the Greenway
- 127 Groton Dr Unit 129
- 127-129 Groton Dr
- 1441 N Cleveland Ave
- 1443 N Cleveland Ave
- 1449 N Cleveland Ave
- 1469 N Cleveland Ave
- 1597 N Cleveland Ave
- 1649 N Cleveland Ave
- 1659 N Cleveland Ave
- 1669 N Cleveland Ave
- 119 Groton Dr Unit 121
- 2107 N Cleveland Ave
- 2111 N Cleveland Ave
- 1517 N Cleveland Ave
- 1567 N Cleveland Ave
- 104 Keene Dr Unit 106
- 111 Groton Dr Unit 113
- 111-113 Groton Dr
- 103 Keene Dr
- 96 Keene Dr Unit 98