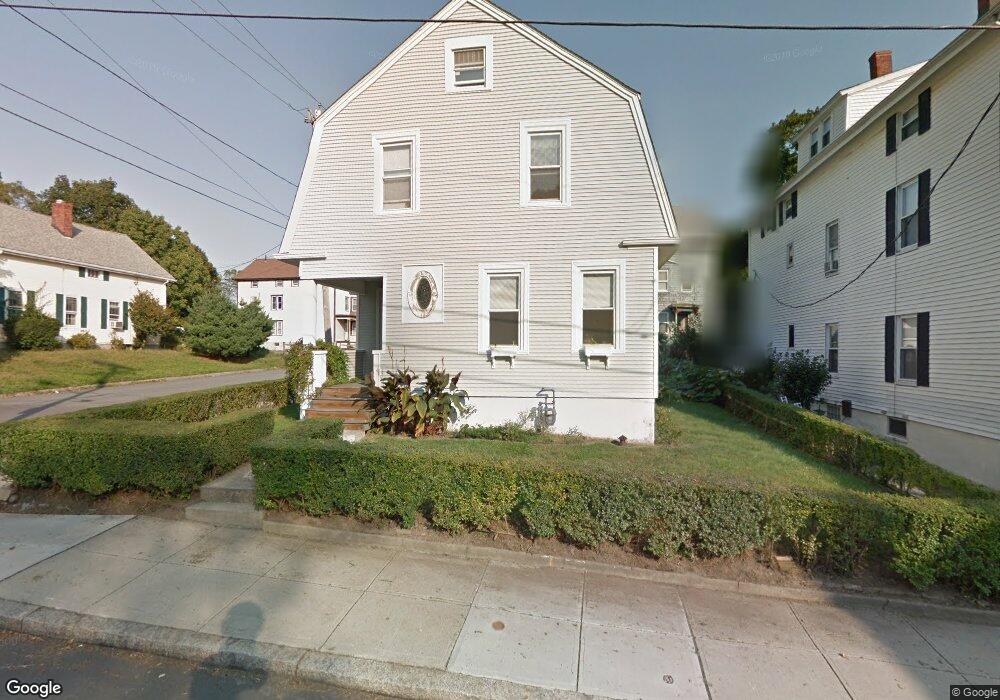
127 Hanover St Fall River, MA 02720
Bank Street NeighborhoodEstimated Value: $375,000 - $452,000
5
Beds
2
Baths
1,808
Sq Ft
$228/Sq Ft
Est. Value
About This Home
This home is located at 127 Hanover St, Fall River, MA 02720 and is currently estimated at $411,543, approximately $227 per square foot. 127 Hanover St is a home located in Bristol County with nearby schools including Mary Fonseca Elementary School, Morton Middle School, and B M C Durfee High School.
Ownership History
Date
Name
Owned For
Owner Type
Purchase Details
Closed on
Mar 4, 2005
Sold by
Smith Nancy T and Smith William F
Bought by
Owen Michelle L and Owen Thomas M
Current Estimated Value
Home Financials for this Owner
Home Financials are based on the most recent Mortgage that was taken out on this home.
Original Mortgage
$38,000
Outstanding Balance
$19,329
Interest Rate
5.66%
Mortgage Type
Purchase Money Mortgage
Estimated Equity
$392,214
Purchase Details
Closed on
Sep 29, 2003
Sold by
Guimond Irene R
Bought by
Smith Nancy T and Smith William F
Home Financials for this Owner
Home Financials are based on the most recent Mortgage that was taken out on this home.
Original Mortgage
$120,000
Interest Rate
5.81%
Create a Home Valuation Report for This Property
The Home Valuation Report is an in-depth analysis detailing your home's value as well as a comparison with similar homes in the area
Home Values in the Area
Average Home Value in this Area
Purchase History
| Date | Buyer | Sale Price | Title Company |
|---|---|---|---|
| Owen Michelle L | $190,000 | -- | |
| Smith Nancy T | -- | -- | |
| Smith Nancy T | $125,000 | -- |
Source: Public Records
Mortgage History
| Date | Status | Borrower | Loan Amount |
|---|---|---|---|
| Open | Smith Nancy T | $38,000 | |
| Open | Smith Nancy T | $152,000 | |
| Previous Owner | Smith Nancy T | $120,000 | |
| Previous Owner | Smith Nancy T | $105,000 |
Source: Public Records
Tax History Compared to Growth
Tax History
| Year | Tax Paid | Tax Assessment Tax Assessment Total Assessment is a certain percentage of the fair market value that is determined by local assessors to be the total taxable value of land and additions on the property. | Land | Improvement |
|---|---|---|---|---|
| 2025 | $4,180 | $365,100 | $114,100 | $251,000 |
| 2024 | $3,926 | $341,700 | $111,900 | $229,800 |
| 2023 | $3,925 | $319,900 | $100,800 | $219,100 |
| 2022 | $3,486 | $276,200 | $95,100 | $181,100 |
| 2021 | $3,296 | $238,300 | $90,800 | $147,500 |
| 2020 | $3,244 | $224,500 | $86,700 | $137,800 |
| 2019 | $3,235 | $221,900 | $90,600 | $131,300 |
| 2018 | $3,094 | $211,600 | $91,300 | $120,300 |
| 2017 | $2,930 | $209,300 | $91,300 | $118,000 |
| 2016 | $2,790 | $204,700 | $94,100 | $110,600 |
| 2015 | $2,679 | $204,800 | $94,100 | $110,700 |
| 2014 | $2,576 | $204,800 | $94,100 | $110,700 |
Source: Public Records
Map
Nearby Homes