Estimated Value: $177,000 - $245,000
3
Beds
2
Baths
1,536
Sq Ft
$131/Sq Ft
Est. Value
About This Home
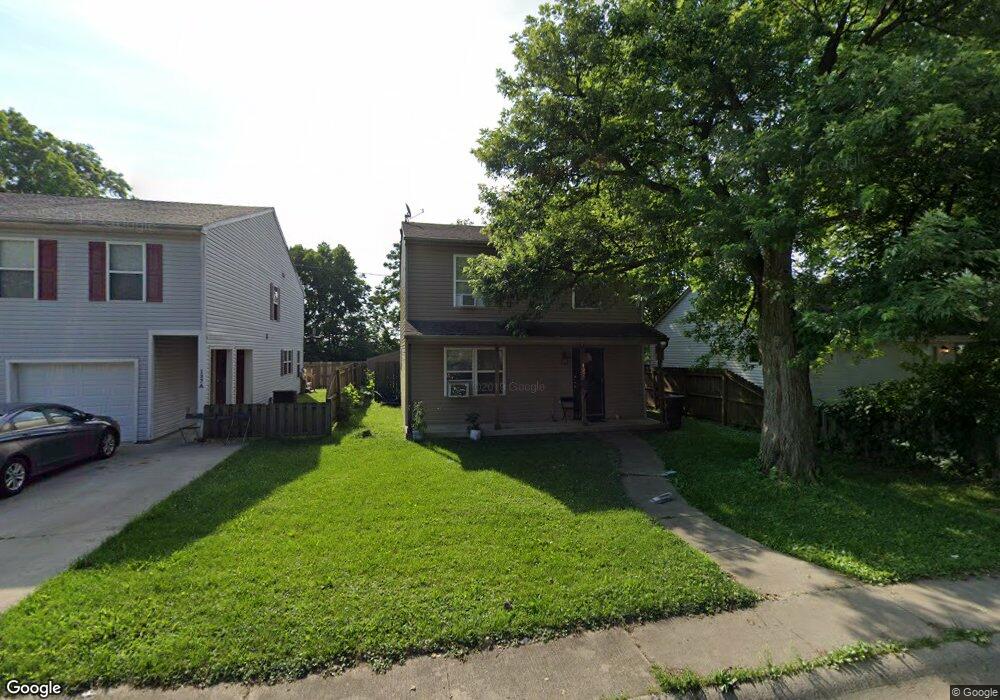
This home is located at 127 Hillcrest Ave, Xenia, OH 45385 and is currently estimated at $201,837, approximately $131 per square foot. 127 Hillcrest Ave is a home located in Greene County with nearby schools including Xenia High School, Summit Academy Community School for Alternative Learners - Xenia, and Legacy Christian Academy.
Ownership History
Date
Name
Owned For
Owner Type
Purchase Details
Closed on
Jun 17, 2013
Sold by
Koehler Charles T
Bought by
Stj Properties Llc and Stj Properties Of Ohio Llc
Current Estimated Value
Home Financials for this Owner
Home Financials are based on the most recent Mortgage that was taken out on this home.
Original Mortgage
$1,263,000
Outstanding Balance
$896,020
Interest Rate
3.43%
Mortgage Type
Unknown
Estimated Equity
-$694,183
Purchase Details
Closed on
Mar 4, 2005
Sold by
Benjamin Realty Ltd
Bought by
Koehler Charles T
Home Financials for this Owner
Home Financials are based on the most recent Mortgage that was taken out on this home.
Original Mortgage
$88,900
Interest Rate
5.67%
Mortgage Type
Unknown
Purchase Details
Closed on
Jun 14, 2004
Sold by
Minton Elbert T and Minton Juanita R
Bought by
Benjamin Realty Ltd
Create a Home Valuation Report for This Property
The Home Valuation Report is an in-depth analysis detailing your home's value as well as a comparison with similar homes in the area
Home Values in the Area
Average Home Value in this Area
Purchase History
| Date | Buyer | Sale Price | Title Company |
|---|---|---|---|
| Stj Properties Llc | $100,000 | None Available | |
| Stj Properties Llc | -- | None Available | |
| Koehler Charles T | -- | -- | |
| Benjamin Realty Ltd | $9,600 | -- |
Source: Public Records
Mortgage History
| Date | Status | Borrower | Loan Amount |
|---|---|---|---|
| Open | Stj Properties Llc | $1,263,000 | |
| Previous Owner | Koehler Charles T | $88,900 |
Source: Public Records
Tax History Compared to Growth
Tax History
| Year | Tax Paid | Tax Assessment Tax Assessment Total Assessment is a certain percentage of the fair market value that is determined by local assessors to be the total taxable value of land and additions on the property. | Land | Improvement |
|---|---|---|---|---|
| 2024 | $2,222 | $51,940 | $2,800 | $49,140 |
| 2023 | $2,222 | $51,940 | $2,800 | $49,140 |
| 2022 | $1,940 | $38,680 | $2,240 | $36,440 |
| 2021 | $1,967 | $38,680 | $2,240 | $36,440 |
| 2020 | $1,884 | $38,680 | $2,240 | $36,440 |
| 2019 | $1,989 | $38,440 | $2,320 | $36,120 |
| 2018 | $1,997 | $38,440 | $2,320 | $36,120 |
| 2017 | $1,939 | $38,440 | $2,320 | $36,120 |
| 2016 | $1,893 | $35,760 | $2,320 | $33,440 |
| 2015 | $1,898 | $35,760 | $2,320 | $33,440 |
| 2014 | $1,517 | $35,760 | $2,320 | $33,440 |
Source: Public Records
Map
Nearby Homes
- 123 Hillcrest Ave
- 137 Hillcrest Ave
- 115 Hillcrest Ave
- 107 Hillcrest Ave
- 128 Hillcrest Ave
- 134 Hillcrest Ave
- 114 Hillcrest Ave
- 99 Hillcrest Ave
- 93 Hillcrest Ave
- 276 Dayton Ave
- 234 Dayton Ave
- 96 Hillcrest Ave
- 672 Vine St
- 664 Vine St
- 141 Little Vine St
- 74 N Orange St
- 74 N Orange St Unit 204
- 696 Vine St
- 296 Dayton Ave
- 716 Vine St