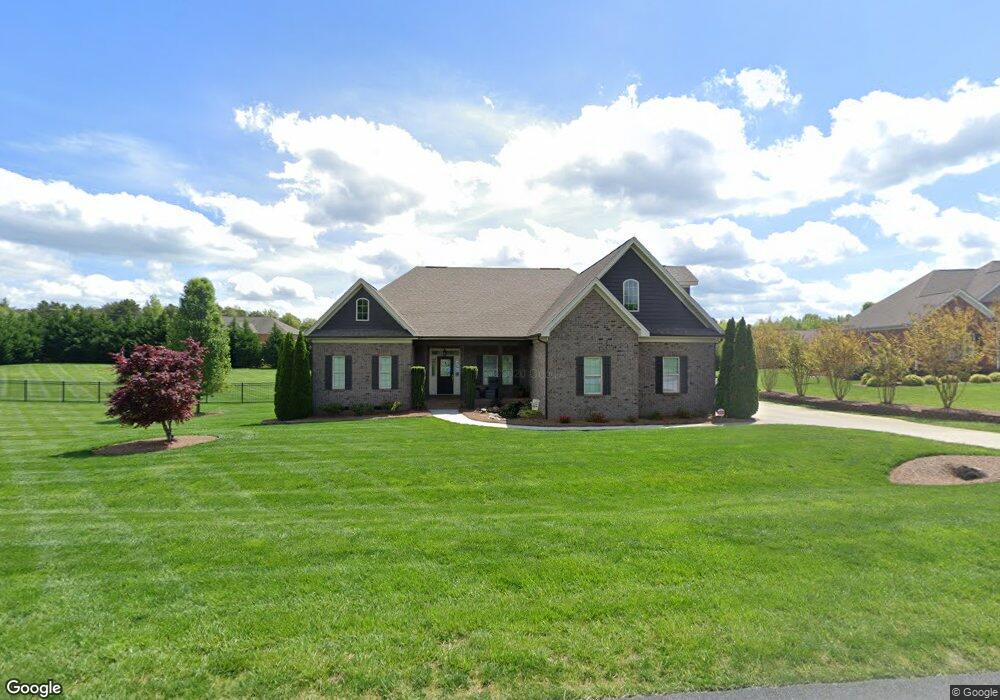
127 Howard Pond Loop Statesville, NC 28625
Estimated Value: $487,348 - $612,000
4
Beds
4
Baths
3,112
Sq Ft
$182/Sq Ft
Est. Value
About This Home
This home is located at 127 Howard Pond Loop, Statesville, NC 28625 and is currently estimated at $567,837, approximately $182 per square foot. 127 Howard Pond Loop is a home located in Iredell County with nearby schools including Cool Spring Elementary School, East Iredell Middle School, and North Iredell High School.
Ownership History
Date
Name
Owned For
Owner Type
Purchase Details
Closed on
Mar 30, 2015
Sold by
Jeffrey Angela H and Jeffrey Shawn M
Bought by
Brown Caroline H
Current Estimated Value
Home Financials for this Owner
Home Financials are based on the most recent Mortgage that was taken out on this home.
Original Mortgage
$240,000
Outstanding Balance
$185,759
Interest Rate
3.89%
Mortgage Type
New Conventional
Estimated Equity
$382,078
Purchase Details
Closed on
Nov 10, 2010
Sold by
Southern Community Bank & Trust
Bought by
Jeffrey Angela H and Jeffrey Shawn M
Home Financials for this Owner
Home Financials are based on the most recent Mortgage that was taken out on this home.
Original Mortgage
$235,000
Interest Rate
4.25%
Mortgage Type
FHA
Purchase Details
Closed on
Aug 25, 2010
Sold by
Kerrigan Homes Llc
Bought by
Southern Community Bank & Trust
Purchase Details
Closed on
Nov 26, 2007
Sold by
Terratek Inc
Bought by
Kerrigan Homes Llc
Create a Home Valuation Report for This Property
The Home Valuation Report is an in-depth analysis detailing your home's value as well as a comparison with similar homes in the area
Home Values in the Area
Average Home Value in this Area
Purchase History
| Date | Buyer | Sale Price | Title Company |
|---|---|---|---|
| Brown Caroline H | $320,000 | None Available | |
| Jeffrey Angela H | $245,000 | None Available | |
| Southern Community Bank & Trust | $265,000 | None Available | |
| Kerrigan Homes Llc | $32,500 | None Available |
Source: Public Records
Mortgage History
| Date | Status | Borrower | Loan Amount |
|---|---|---|---|
| Open | Brown Caroline H | $240,000 | |
| Previous Owner | Jeffrey Angela H | $235,000 |
Source: Public Records
Tax History Compared to Growth
Tax History
| Year | Tax Paid | Tax Assessment Tax Assessment Total Assessment is a certain percentage of the fair market value that is determined by local assessors to be the total taxable value of land and additions on the property. | Land | Improvement |
|---|---|---|---|---|
| 2024 | $2,569 | $425,290 | $40,000 | $385,290 |
| 2023 | $2,569 | $425,290 | $40,000 | $385,290 |
| 2022 | $2,027 | $313,520 | $32,000 | $281,520 |
| 2021 | $2,023 | $313,520 | $32,000 | $281,520 |
| 2020 | $2,023 | $313,520 | $32,000 | $281,520 |
| 2019 | $1,992 | $313,520 | $32,000 | $281,520 |
| 2018 | $1,716 | $278,510 | $28,000 | $250,510 |
| 2017 | $1,716 | $278,510 | $28,000 | $250,510 |
| 2016 | $1,716 | $278,510 | $28,000 | $250,510 |
| 2015 | $1,716 | $278,510 | $28,000 | $250,510 |
| 2014 | $1,747 | $305,330 | $28,000 | $277,330 |
Source: Public Records
Map
Nearby Homes
- 158 Winding Brook Way
- 197 Sain Rd
- 000 Pops Lake Rd
- 309 Sain Rd
- 0 Warren Rd Unit 3814365
- 181 Lone Pine Rd
- 188 Gays Chapel Rd
- 215 Lone Pine Rd
- 134 Portman Ln
- 258 New Salem Rd
- 494 New Salem Rd
- 307 Lone Pine Rd
- 306 Lone Pine Rd
- 358 New Salem Rd
- 143 Mills Garden Rd
- 149 Mills Garden Rd Unit 1
- 153 Mills Garden Rd
- 195 Bell Farm Rd
- 152 Sparrow Ln
- 175 Honey Lotus Ln Unit 15
- 133 Howard Pond Loop
- 133 Howard Pond Loop Unit 45
- 121 Howard Pond Loop
- 128 Howard Pond Loop
- 151 Sain Rd
- 115 Howard Pond Loop
- 137 Howard Pond Loop
- 145 Sain Rd
- 157 Sain Rd
- 143 Howard Pond Loop
- 154 Howard Pond Loop
- 114 Winding Brook Way
- 133 Sain Rd
- 108 Howard Pond Loop
- 169 Sain Rd
- 111 Knollcrest Ln
- 149 Howard Pond Loop
- 118 Winding Brook Way
- 146 Sain Rd
- 103 Howard Pond Loop Unit 40