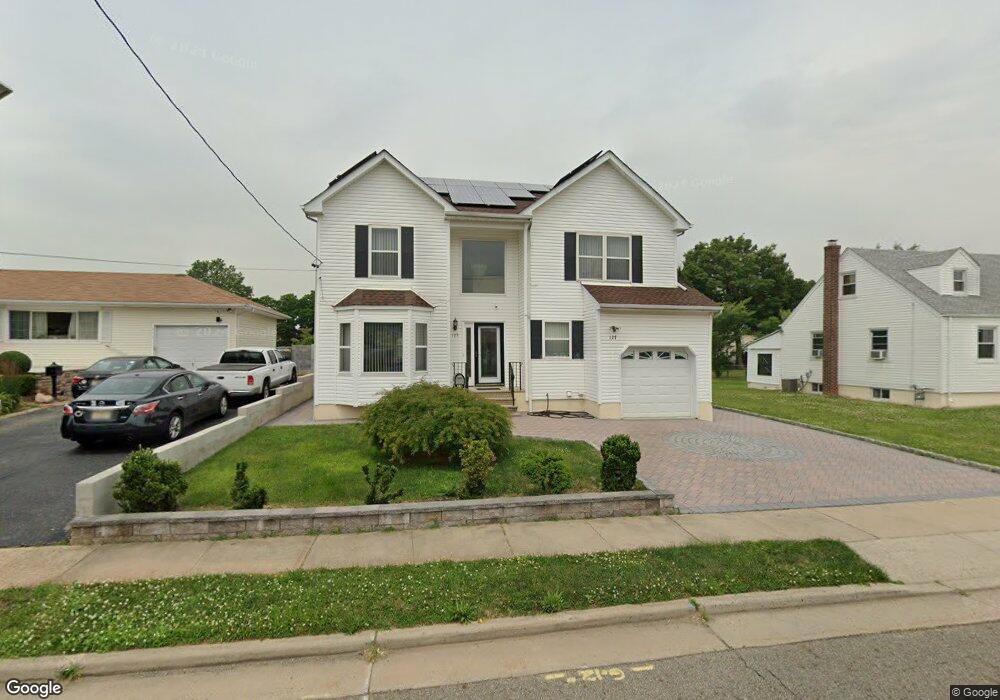
127 Jackson Ave Carteret, NJ 07008
Estimated Value: $619,000 - $794,000
--
Bed
--
Bath
2,044
Sq Ft
$341/Sq Ft
Est. Value
About This Home
This home is located at 127 Jackson Ave, Carteret, NJ 07008 and is currently estimated at $697,110, approximately $341 per square foot. 127 Jackson Ave is a home located in Middlesex County with nearby schools including Carteret High School and St Joseph School.
Ownership History
Date
Name
Owned For
Owner Type
Purchase Details
Closed on
Sep 19, 2002
Sold by
Rivera Jacinto
Bought by
Varaitch Raham and Varaitch Balbir
Current Estimated Value
Home Financials for this Owner
Home Financials are based on the most recent Mortgage that was taken out on this home.
Original Mortgage
$210,000
Outstanding Balance
$87,916
Interest Rate
6.27%
Estimated Equity
$609,194
Purchase Details
Closed on
Mar 8, 2000
Sold by
Mocci Anthony
Bought by
Rivera Jacinto and Rivera Rocio
Home Financials for this Owner
Home Financials are based on the most recent Mortgage that was taken out on this home.
Original Mortgage
$190,893
Interest Rate
8.24%
Mortgage Type
VA
Create a Home Valuation Report for This Property
The Home Valuation Report is an in-depth analysis detailing your home's value as well as a comparison with similar homes in the area
Home Values in the Area
Average Home Value in this Area
Purchase History
| Date | Buyer | Sale Price | Title Company |
|---|---|---|---|
| Varaitch Raham | $340,000 | -- | |
| Rivera Jacinto | $197,000 | -- |
Source: Public Records
Mortgage History
| Date | Status | Borrower | Loan Amount |
|---|---|---|---|
| Open | Varaitch Raham | $210,000 | |
| Previous Owner | Rivera Jacinto | $190,893 |
Source: Public Records
Tax History Compared to Growth
Tax History
| Year | Tax Paid | Tax Assessment Tax Assessment Total Assessment is a certain percentage of the fair market value that is determined by local assessors to be the total taxable value of land and additions on the property. | Land | Improvement |
|---|---|---|---|---|
| 2025 | $11,767 | $707,700 | $350,000 | $357,700 |
| 2024 | $11,464 | $369,100 | $115,000 | $254,100 |
| 2023 | $11,464 | $369,100 | $115,000 | $254,100 |
| 2022 | $11,147 | $369,100 | $115,000 | $254,100 |
| 2021 | $7,591 | $369,100 | $115,000 | $254,100 |
| 2020 | $10,615 | $369,100 | $115,000 | $254,100 |
| 2019 | $10,309 | $369,100 | $115,000 | $254,100 |
| 2018 | $10,065 | $369,100 | $115,000 | $254,100 |
| 2017 | $9,707 | $369,100 | $115,000 | $254,100 |
| 2016 | $10,433 | $323,200 | $80,000 | $243,200 |
| 2015 | $10,087 | $323,200 | $80,000 | $243,200 |
| 2014 | $9,648 | $323,200 | $80,000 | $243,200 |
Source: Public Records
Map
Nearby Homes