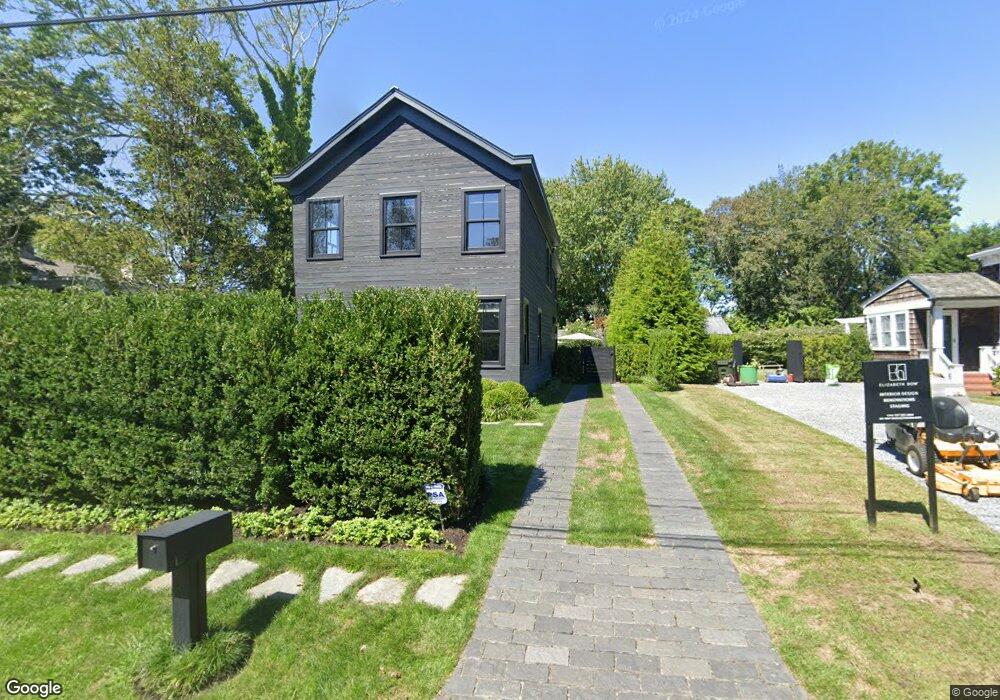
127 Jermain Ave Sag Harbor, NY 11963
Estimated Value: $3,445,000 - $4,556,000
4
Beds
2
Baths
2,140
Sq Ft
$1,894/Sq Ft
Est. Value
About This Home
This home is located at 127 Jermain Ave, Sag Harbor, NY 11963 and is currently estimated at $4,052,413, approximately $1,893 per square foot. 127 Jermain Ave is a home located in Suffolk County with nearby schools including Sag Harbor Elementary School and Pierson Middle/High School.
Ownership History
Date
Name
Owned For
Owner Type
Purchase Details
Closed on
Aug 30, 2018
Sold by
Ricker Joseph A and Ricker Ester
Bought by
Dow Elizabeth C and Antreasyan Ani
Current Estimated Value
Home Financials for this Owner
Home Financials are based on the most recent Mortgage that was taken out on this home.
Original Mortgage
$450,000
Outstanding Balance
$391,618
Interest Rate
4.5%
Mortgage Type
Stand Alone Refi Refinance Of Original Loan
Estimated Equity
$3,660,795
Purchase Details
Closed on
Apr 27, 2006
Create a Home Valuation Report for This Property
The Home Valuation Report is an in-depth analysis detailing your home's value as well as a comparison with similar homes in the area
Home Values in the Area
Average Home Value in this Area
Purchase History
| Date | Buyer | Sale Price | Title Company |
|---|---|---|---|
| Dow Elizabeth C | $890,000 | -- | |
| -- | -- | -- |
Source: Public Records
Mortgage History
| Date | Status | Borrower | Loan Amount |
|---|---|---|---|
| Open | Dow Elizabeth C | $450,000 |
Source: Public Records
Tax History Compared to Growth
Tax History
| Year | Tax Paid | Tax Assessment Tax Assessment Total Assessment is a certain percentage of the fair market value that is determined by local assessors to be the total taxable value of land and additions on the property. | Land | Improvement |
|---|---|---|---|---|
| 2024 | $7,973 | $2,870,600 | $662,400 | $2,208,200 |
| 2023 | $7,894 | $2,870,600 | $662,400 | $2,208,200 |
| 2022 | $7,795 | $2,870,600 | $662,400 | $2,208,200 |
| 2021 | $7,490 | $2,741,400 | $662,400 | $2,079,000 |
| 2020 | $4,782 | $860,900 | $662,400 | $198,500 |
| 2019 | $6,701 | $0 | $0 | $0 |
| 2018 | -- | $719,400 | $529,900 | $189,500 |
| 2017 | $3,468 | $678,700 | $489,200 | $189,500 |
| 2016 | $3,605 | $678,700 | $489,200 | $189,500 |
| 2015 | -- | $678,700 | $489,200 | $189,500 |
| 2014 | -- | $678,700 | $489,200 | $189,500 |
Source: Public Records
Map
Nearby Homes