127 Lopez Rd Unit 14 Lopez Island, WA 98261
Estimated Value: $583,000 - $652,261
2
Beds
2
Baths
1,271
Sq Ft
$487/Sq Ft
Est. Value
About This Home
This home is located at 127 Lopez Rd Unit 14, Lopez Island, WA 98261 and is currently estimated at $618,754, approximately $486 per square foot. 127 Lopez Rd Unit 14 is a home located in San Juan County with nearby schools including Lopez Elementary School and Lopez Middle High School.
Ownership History
Date
Name
Owned For
Owner Type
Purchase Details
Closed on
Jun 5, 2025
Sold by
Marylinda Knold Richardson and Marylinda Bruce Dou
Bought by
Grimes Watson Edward and Grimes Karen Sue
Current Estimated Value
Purchase Details
Closed on
Mar 26, 2025
Sold by
Keeler George Eldridge and Keeler Vivien Kay
Bought by
Marylinda Knold Richardson and Marylinda Bruce Douglas
Purchase Details
Closed on
Feb 22, 2019
Sold by
Steele Robert A and Swift Mary G
Bought by
Keeler George Eldridge and Smith Keeler Vivien Kay
Purchase Details
Closed on
Oct 6, 2006
Sold by
Marsh Barbara
Bought by
Steele Robert A and Swift Mary Grace
Home Financials for this Owner
Home Financials are based on the most recent Mortgage that was taken out on this home.
Original Mortgage
$200,000
Interest Rate
6.44%
Mortgage Type
Commercial
Purchase Details
Closed on
Oct 7, 2005
Sold by
White Mary E
Bought by
Marsh Barbara
Home Financials for this Owner
Home Financials are based on the most recent Mortgage that was taken out on this home.
Original Mortgage
$280,000
Interest Rate
5.63%
Mortgage Type
Commercial
Create a Home Valuation Report for This Property
The Home Valuation Report is an in-depth analysis detailing your home's value as well as a comparison with similar homes in the area
Home Values in the Area
Average Home Value in this Area
Purchase History
| Date | Buyer | Sale Price | Title Company |
|---|---|---|---|
| Grimes Watson Edward | $625,000 | Chicago Title | |
| Marylinda Knold Richardson | $610,000 | Chicago Title | |
| Keeler George Eldridge | $380,000 | None Available | |
| Steele Robert A | $413,000 | Chicago Title Co | |
| Marsh Barbara | $350,000 | San Juan Title Insurance |
Source: Public Records
Mortgage History
| Date | Status | Borrower | Loan Amount |
|---|---|---|---|
| Previous Owner | Steele Robert A | $200,000 | |
| Previous Owner | Marsh Barbara | $280,000 |
Source: Public Records
Tax History Compared to Growth
Tax History
| Year | Tax Paid | Tax Assessment Tax Assessment Total Assessment is a certain percentage of the fair market value that is determined by local assessors to be the total taxable value of land and additions on the property. | Land | Improvement |
|---|---|---|---|---|
| 2024 | $3,076 | $523,730 | -- | $523,730 |
| 2023 | $3,076 | $531,130 | $0 | $531,130 |
| 2022 | $3,159 | $518,460 | $214,200 | $304,260 |
| 2021 | $3,017 | $411,640 | $178,500 | $233,140 |
| 2020 | $3,035 | $394,250 | $178,500 | $215,750 |
| 2019 | $2,682 | $399,970 | $178,500 | $221,470 |
| 2018 | $2,893 | $528,680 | $353,590 | $175,090 |
| 2017 | $2,815 | $348,180 | $170,000 | $178,180 |
| 2016 | $2,142 | $403,580 | $157,250 | $246,330 |
| 2015 | $2,142 | $408,880 | $157,250 | $251,630 |
| 2014 | $2,142 | $348,460 | $185,000 | $163,460 |
| 2012 | $2,142 | $341,390 | $185,000 | $156,390 |
Source: Public Records
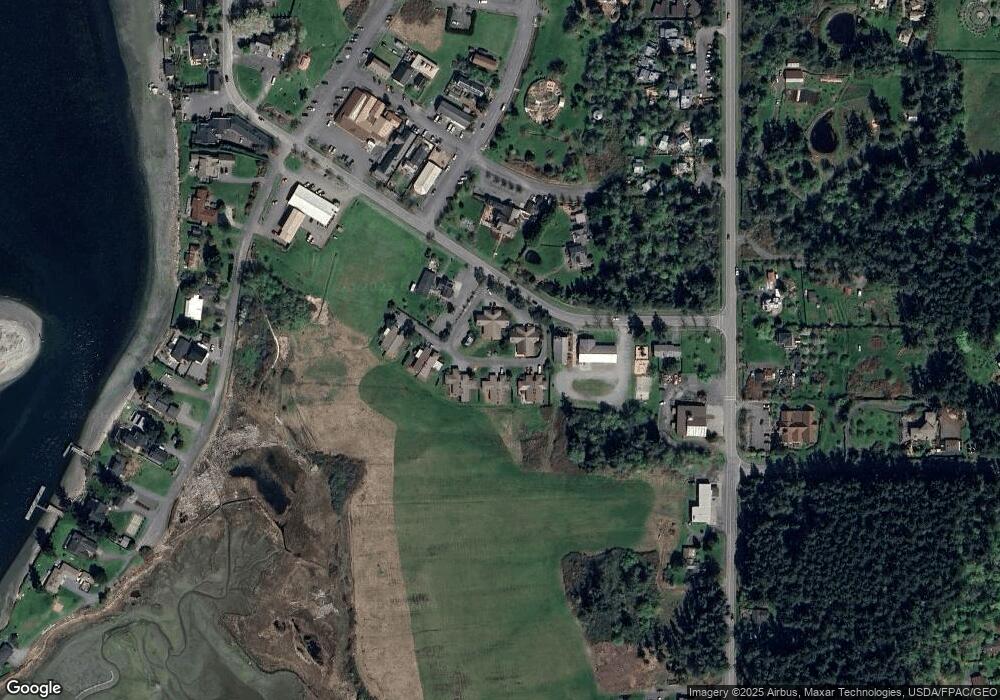
Map
Nearby Homes
- 295 Rum Runner Rd
- 27 Dryad Place
- 1486 Center Rd
- 140 Sweetbrier Ln
- 472 Redtail Ln
- 1372 Bakerview Rd
- 0 Channel Rd Unit NWM2377246
- 2623 Pear Point Rd
- 239 Shoreland Dr
- 0 Pear Point Rd
- 755 Ferry Rd
- 317 Eagles Roost Ln
- 86 - 88 Pinedrona Ln
- 162 Sea Ranch Rd
- 549 Davis Bay Rd
- 362 Hilltop Way
- 68 Sylvan Cove Rd W
- 0 EC-19 E Cove Rd
- 177 Harmon Ranch Hill Rd
- 630 Harrison St
- 127 Lopez Rd Unit 7
- 127 Lopez Rd Unit 6
- 127 Lopez Rd Unit 5
- 127 Lopez Rd Unit 2
- 127 Lopez Rd Unit 10
- 127 Lopez Rd Unit 13
- 127 Lopez Rd
- 127 Lopez Rd Unit 1
- 127 Lopez Rd Unit 4
- 135 Lopez Rd
- 132 Lopez Rd
- 134 Eads Ln
- 192 Lopez Rd
- 211 Lopez Rd Unit 5
- 5 Lopez Rd Unit 5
- 2262 Fisherman Bay Rd
- 0 Lopez Rd
- 0 Lopez Rd Unit 1718823
- 86 Weeks Point Way
- 2205 Fisherman Bay Rd