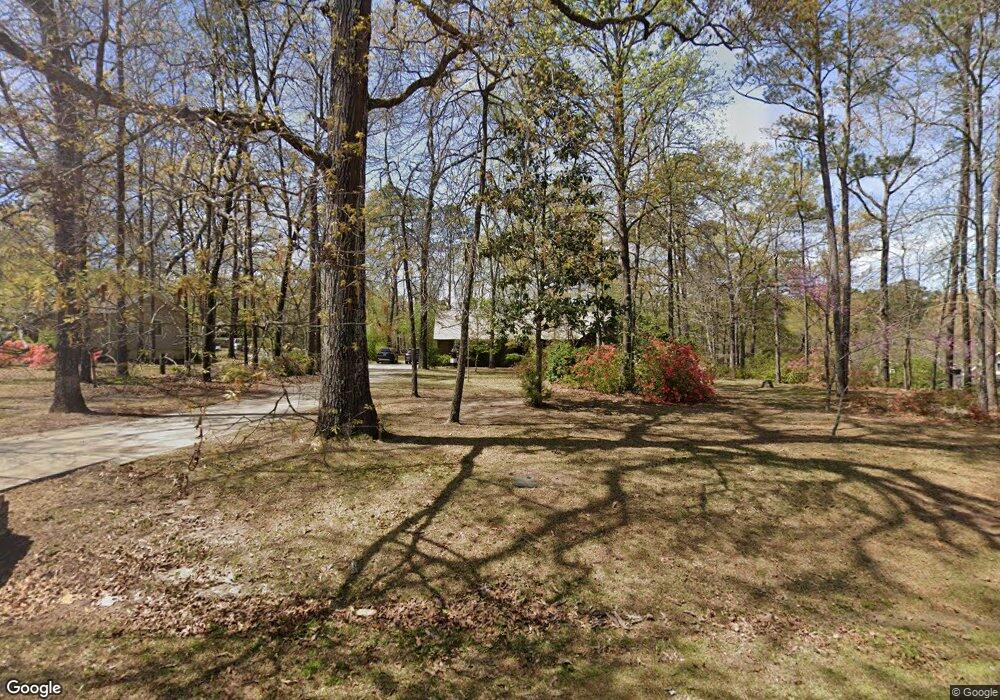
127 Mack Ln Warner Robins, GA 31088
Estimated Value: $228,796 - $277,000
--
Bed
1
Bath
1,814
Sq Ft
$142/Sq Ft
Est. Value
About This Home
This home is located at 127 Mack Ln, Warner Robins, GA 31088 and is currently estimated at $256,949, approximately $141 per square foot. 127 Mack Ln is a home located in Houston County with nearby schools including Quail Run Elementary School, Thomson Middle School, and Northside High School.
Ownership History
Date
Name
Owned For
Owner Type
Purchase Details
Closed on
Jul 9, 2019
Sold by
Horer James K and Horer Ann D
Bought by
Horer James K and Horer Dorothy Ann
Current Estimated Value
Purchase Details
Closed on
Jul 10, 1992
Sold by
Wallace James T and Wallace Stephany G
Bought by
Horer James K and Horer Ann D
Purchase Details
Closed on
May 28, 1982
Sold by
Cleghorn Debbie
Bought by
Wallace James T and Wallace Stephany G
Purchase Details
Closed on
May 25, 1982
Sold by
Cleghorn Stan E and Cleghorn Debbie
Bought by
Wallace James T and Wallace Stephany G
Purchase Details
Closed on
Sep 25, 1978
Sold by
Cleghorn Stanley E
Bought by
Cleghorn Stan E and Cleghorn Debbie
Purchase Details
Closed on
Aug 7, 1977
Sold by
Jason Enterprises Inc
Bought by
Cleghorn Stanley E
Purchase Details
Closed on
Jun 16, 1977
Sold by
Pilcher B Lamar
Bought by
Jason Enterprises Inc
Create a Home Valuation Report for This Property
The Home Valuation Report is an in-depth analysis detailing your home's value as well as a comparison with similar homes in the area
Home Values in the Area
Average Home Value in this Area
Purchase History
| Date | Buyer | Sale Price | Title Company |
|---|---|---|---|
| Horer James K | -- | None Available | |
| Horer James K | $112,000 | -- | |
| Wallace James T | -- | -- | |
| Wallace James T | -- | -- | |
| Cleghorn Stan E | -- | -- | |
| Cleghorn Stanley E | -- | -- | |
| Jason Enterprises Inc | -- | -- |
Source: Public Records
Tax History Compared to Growth
Tax History
| Year | Tax Paid | Tax Assessment Tax Assessment Total Assessment is a certain percentage of the fair market value that is determined by local assessors to be the total taxable value of land and additions on the property. | Land | Improvement |
|---|---|---|---|---|
| 2024 | $1,826 | $78,320 | $12,000 | $66,320 |
| 2023 | $1,544 | $65,880 | $12,000 | $53,880 |
| 2022 | $1,458 | $62,320 | $11,200 | $51,120 |
| 2021 | $1,298 | $55,440 | $11,200 | $44,240 |
| 2020 | $1,179 | $50,320 | $11,200 | $39,120 |
| 2019 | $1,179 | $50,320 | $11,200 | $39,120 |
| 2018 | $1,179 | $50,320 | $11,200 | $39,120 |
| 2017 | $1,181 | $50,320 | $11,200 | $39,120 |
| 2016 | $1,182 | $50,320 | $11,200 | $39,120 |
| 2015 | $1,181 | $50,160 | $11,200 | $38,960 |
| 2014 | -- | $50,160 | $11,200 | $38,960 |
| 2013 | -- | $50,160 | $11,200 | $38,960 |
Source: Public Records
Map
Nearby Homes
- 116 Joy Dr
- 102 Monarch Place
- 103 Emberly Ln
- GRANBY Plan at David's Place
- GARDNER Plan at David's Place
- KINGSTON Plan at David's Place
- 314 Briarmoor Dr
- 410 Clayton Scott St
- 409 Clayton Scott St
- 401 Clayton Scott St
- 405 Clayton Scott St
- 400 Clayton Scott St
- 315 Clayton Scott St
- 313 Clayton Scott St
- 311 Clayton Scott St
- 309 Clayton Scott St
- 305 Clayton Scott St
- 204 Scotsburg Dr
- 100 Davids Place Dr