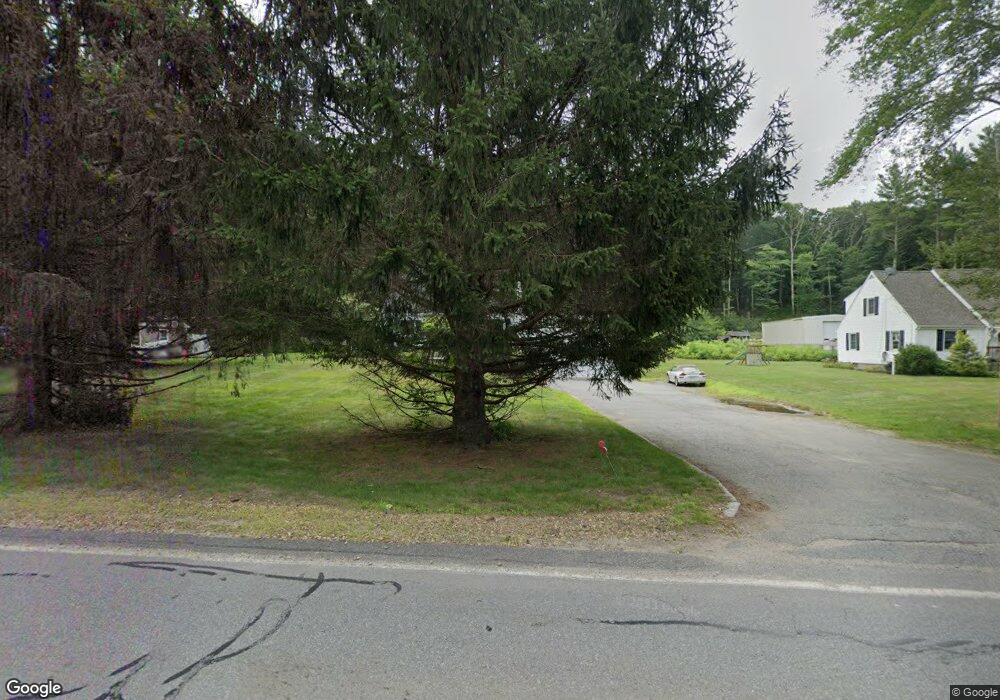
127 Main St Douglas, MA 01516
Estimated Value: $492,000 - $520,753
3
Beds
2
Baths
1,862
Sq Ft
$273/Sq Ft
Est. Value
About This Home
This home is located at 127 Main St, Douglas, MA 01516 and is currently estimated at $507,438, approximately $272 per square foot. 127 Main St is a home located in Worcester County with nearby schools including Douglas Primary School, Douglas Middle School, and Douglas High School.
Ownership History
Date
Name
Owned For
Owner Type
Purchase Details
Closed on
Apr 13, 2022
Sold by
Stanick Michael G and Stanick Linda A
Bought by
Main Street 2022 Rt
Current Estimated Value
Purchase Details
Closed on
Sep 28, 1977
Bought by
Stanick Michael G and Stanick Linda
Create a Home Valuation Report for This Property
The Home Valuation Report is an in-depth analysis detailing your home's value as well as a comparison with similar homes in the area
Home Values in the Area
Average Home Value in this Area
Purchase History
| Date | Buyer | Sale Price | Title Company |
|---|---|---|---|
| Main Street 2022 Rt | -- | None Available | |
| Stanick Michael G | -- | -- |
Source: Public Records
Mortgage History
| Date | Status | Borrower | Loan Amount |
|---|---|---|---|
| Previous Owner | Stanick Michael G | $272,160 | |
| Previous Owner | Stanick Michael G | $170,000 | |
| Previous Owner | Stanick Michael G | $109,500 |
Source: Public Records
Tax History Compared to Growth
Tax History
| Year | Tax Paid | Tax Assessment Tax Assessment Total Assessment is a certain percentage of the fair market value that is determined by local assessors to be the total taxable value of land and additions on the property. | Land | Improvement |
|---|---|---|---|---|
| 2025 | $51 | $387,600 | $82,500 | $305,100 |
| 2024 | $5,039 | $372,700 | $75,000 | $297,700 |
| 2023 | $4,934 | $343,600 | $75,000 | $268,600 |
| 2022 | $5,056 | $309,400 | $69,300 | $240,100 |
| 2021 | $4,892 | $292,600 | $66,000 | $226,600 |
| 2020 | $4,793 | $282,300 | $66,000 | $216,300 |
| 2019 | $4,678 | $267,300 | $66,000 | $201,300 |
| 2018 | $4,188 | $260,600 | $66,000 | $194,600 |
| 2017 | $4,070 | $243,400 | $70,700 | $172,700 |
| 2016 | $3,958 | $235,300 | $70,700 | $164,600 |
| 2015 | $3,873 | $235,300 | $70,700 | $164,600 |
Source: Public Records
Map
Nearby Homes