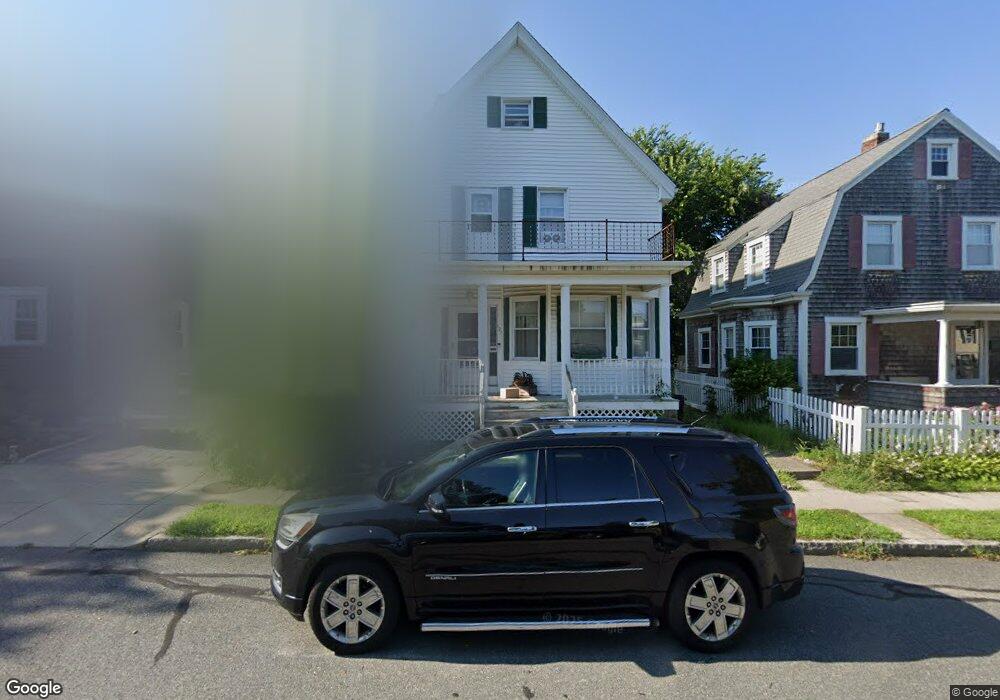
127 Maple St New Bedford, MA 02740
Downtown New Bedford NeighborhoodEstimated Value: $423,484 - $453,000
3
Beds
2
Baths
1,720
Sq Ft
$255/Sq Ft
Est. Value
About This Home
This home is located at 127 Maple St, New Bedford, MA 02740 and is currently estimated at $438,871, approximately $255 per square foot. 127 Maple St is a home located in Bristol County with nearby schools including Ellen R. Hathaway Elementary School, Keith Middle School, and New Bedford High School.
Ownership History
Date
Name
Owned For
Owner Type
Purchase Details
Closed on
Oct 19, 2007
Sold by
Yates Rose A
Bought by
Daye Raymond M and Daye Sherri L
Current Estimated Value
Home Financials for this Owner
Home Financials are based on the most recent Mortgage that was taken out on this home.
Original Mortgage
$208,550
Outstanding Balance
$132,235
Interest Rate
6.51%
Mortgage Type
Purchase Money Mortgage
Estimated Equity
$306,636
Purchase Details
Closed on
Jun 23, 1998
Sold by
Neto Michael N and Neto Diamantina
Bought by
Yates Rose A
Purchase Details
Closed on
Jan 30, 1997
Sold by
First Citizens Fsb
Bought by
Neto Michael N and Neto Diamantia
Purchase Details
Closed on
Nov 28, 1988
Sold by
Conery Michael
Bought by
Martin Brian A
Create a Home Valuation Report for This Property
The Home Valuation Report is an in-depth analysis detailing your home's value as well as a comparison with similar homes in the area
Home Values in the Area
Average Home Value in this Area
Purchase History
| Date | Buyer | Sale Price | Title Company |
|---|---|---|---|
| Daye Raymond M | $215,000 | -- | |
| Daye Raymond M | $215,000 | -- | |
| Yates Rose A | $112,500 | -- | |
| Yates Rose A | $112,500 | -- | |
| Neto Michael N | $83,000 | -- | |
| Neto Michael N | $83,000 | -- | |
| Martin Brian A | $118,000 | -- |
Source: Public Records
Mortgage History
| Date | Status | Borrower | Loan Amount |
|---|---|---|---|
| Open | Martin Brian A | $208,550 | |
| Closed | Martin Brian A | $6,450 |
Source: Public Records
Tax History
| Year | Tax Paid | Tax Assessment Tax Assessment Total Assessment is a certain percentage of the fair market value that is determined by local assessors to be the total taxable value of land and additions on the property. | Land | Improvement |
|---|---|---|---|---|
| 2025 | $4,324 | $382,300 | $96,600 | $285,700 |
| 2024 | $3,862 | $321,800 | $98,200 | $223,600 |
| 2023 | $4,123 | $288,500 | $84,700 | $203,800 |
| 2022 | $3,787 | $243,700 | $80,500 | $163,200 |
| 2021 | $3,639 | $233,400 | $80,500 | $152,900 |
| 2020 | $3,478 | $215,200 | $80,500 | $134,700 |
| 2019 | $3,343 | $203,000 | $80,500 | $122,500 |
| 2018 | $3,105 | $186,700 | $80,500 | $106,200 |
| 2017 | $2,994 | $179,400 | $80,500 | $98,900 |
| 2016 | $2,894 | $175,500 | $80,500 | $95,000 |
| 2015 | $2,724 | $173,200 | $80,500 | $92,700 |
| 2014 | $2,545 | $167,900 | $75,700 | $92,200 |
Source: Public Records
Map
Nearby Homes
Your Personal Tour Guide
Ask me questions while you tour the home.