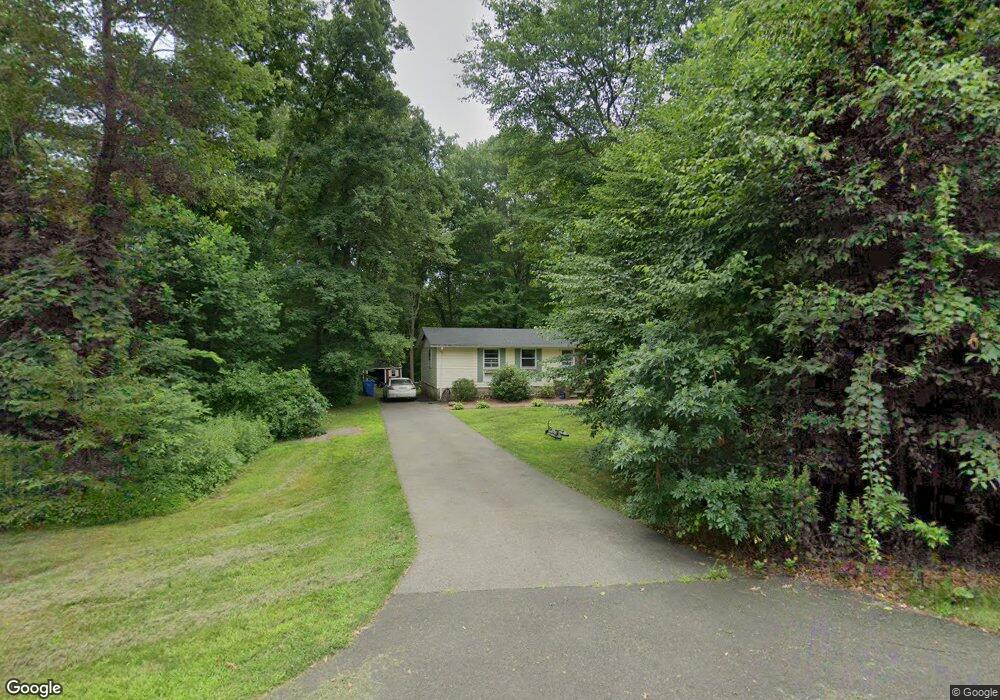
127 McTigh Rd Higganum, CT 06441
Estimated Value: $237,000 - $345,000
3
Beds
1
Bath
1,032
Sq Ft
$300/Sq Ft
Est. Value
About This Home
This home is located at 127 McTigh Rd, Higganum, CT 06441 and is currently estimated at $309,945, approximately $300 per square foot. 127 McTigh Rd is a home located in Middlesex County with nearby schools including Haddam-Killingworth High School.
Ownership History
Date
Name
Owned For
Owner Type
Purchase Details
Closed on
Dec 23, 2021
Sold by
Hollman Robert T and Hollman Kathleen P
Bought by
Hollman Matthew T and Bernard Kyra H
Current Estimated Value
Home Financials for this Owner
Home Financials are based on the most recent Mortgage that was taken out on this home.
Original Mortgage
$106,835
Outstanding Balance
$98,088
Interest Rate
2.98%
Mortgage Type
FHA
Estimated Equity
$211,857
Purchase Details
Closed on
Jan 3, 2012
Sold by
Hollman Robert T and Hollma Kathleen P
Bought by
Hollman Thomas P and Oboyle Maureen
Purchase Details
Closed on
Jul 29, 1988
Sold by
Malterfis Karla
Bought by
Hollman Robert
Home Financials for this Owner
Home Financials are based on the most recent Mortgage that was taken out on this home.
Original Mortgage
$108,800
Interest Rate
10.39%
Create a Home Valuation Report for This Property
The Home Valuation Report is an in-depth analysis detailing your home's value as well as a comparison with similar homes in the area
Home Values in the Area
Average Home Value in this Area
Purchase History
| Date | Buyer | Sale Price | Title Company |
|---|---|---|---|
| Hollman Matthew T | $200,000 | None Available | |
| Hollman Thomas P | -- | -- | |
| Hollman Robert | -- | -- | |
| Hollman Robert | $136,000 | -- |
Source: Public Records
Mortgage History
| Date | Status | Borrower | Loan Amount |
|---|---|---|---|
| Open | Hollman Matthew T | $106,835 | |
| Previous Owner | Hollman Robert | $108,800 |
Source: Public Records
Tax History Compared to Growth
Tax History
| Year | Tax Paid | Tax Assessment Tax Assessment Total Assessment is a certain percentage of the fair market value that is determined by local assessors to be the total taxable value of land and additions on the property. | Land | Improvement |
|---|---|---|---|---|
| 2025 | $4,174 | $121,520 | $56,700 | $64,820 |
| 2024 | $4,174 | $121,520 | $56,700 | $64,820 |
| 2023 | $4,116 | $121,520 | $56,700 | $64,820 |
| 2022 | $3,929 | $121,520 | $56,700 | $64,820 |
| 2021 | $3,908 | $121,520 | $56,700 | $64,820 |
| 2020 | $4,150 | $130,950 | $63,700 | $67,250 |
| 2019 | $4,150 | $130,950 | $63,700 | $67,250 |
| 2018 | $4,150 | $130,950 | $63,700 | $67,250 |
| 2017 | $4,150 | $130,950 | $63,700 | $67,250 |
| 2016 | $4,086 | $130,950 | $63,700 | $67,250 |
| 2015 | $4,224 | $135,370 | $63,700 | $71,670 |
| 2014 | $4,182 | $135,370 | $63,700 | $71,670 |
Source: Public Records
Map
Nearby Homes
- 16 Hidden Lake Rd
- 279 Pokorny Rd
- 63 Burr Rd
- 28 Fieldstone Ln
- 12 Jackson Rd
- 52 Sima Rd
- 882 Killingworth Rd
- 7 Little Fawn Trail
- 63 Laurel Grove Dr
- 13 Cranberry Meadow Ln
- 0 S Dish Mill Rd Unit 24082788
- 12 Rachel Ct
- 209 Wiese Albert Rd
- 521 Foot Hills Rd
- 32 Maple Ave W
- 511 Route 81
- 72 Dickinson Rd
- 25 Route 79
- 275 Route 148
- 86 Christian Hill Rd