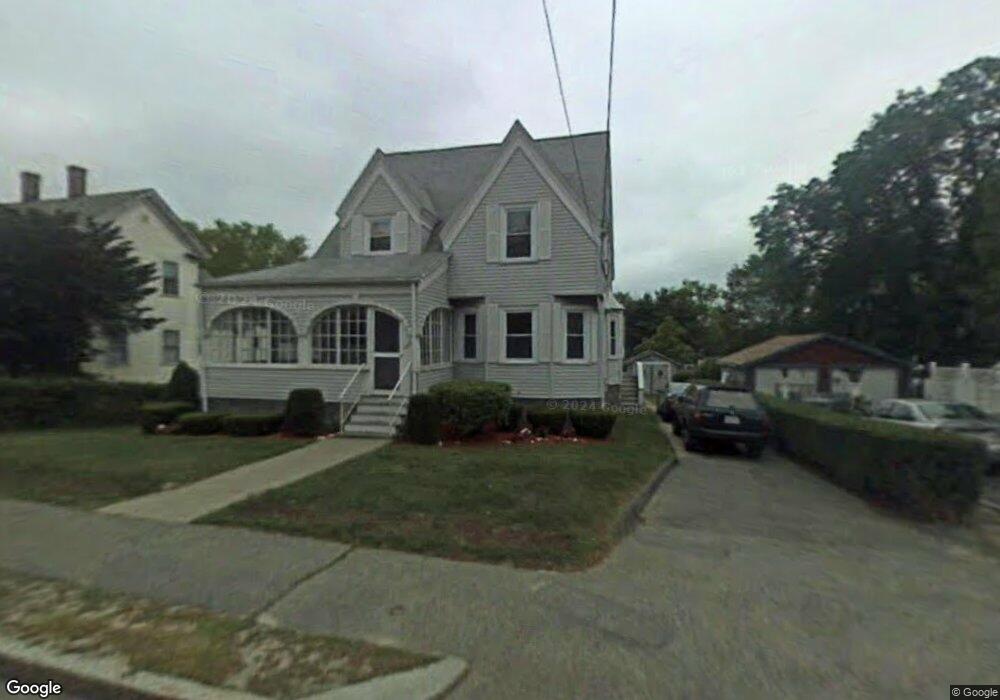
127 Middle St Braintree, MA 02184
East Braintree NeighborhoodEstimated Value: $829,154 - $899,000
4
Beds
2
Baths
2,497
Sq Ft
$349/Sq Ft
Est. Value
About This Home
This home is located at 127 Middle St, Braintree, MA 02184 and is currently estimated at $870,289, approximately $348 per square foot. 127 Middle St is a home located in Norfolk County with nearby schools including Braintree High School, Step Ahead Kindergarten, and Meeting House Montessori School.
Ownership History
Date
Name
Owned For
Owner Type
Purchase Details
Closed on
Dec 24, 2008
Sold by
Kelly Marjorie A
Bought by
Amado Francisco and Amado Laura Q
Current Estimated Value
Home Financials for this Owner
Home Financials are based on the most recent Mortgage that was taken out on this home.
Original Mortgage
$364,417
Outstanding Balance
$242,237
Interest Rate
6.17%
Mortgage Type
Purchase Money Mortgage
Estimated Equity
$628,052
Purchase Details
Closed on
Jun 3, 2002
Sold by
Daly Joseph W and Daly Elizabeth A
Bought by
Daly Peter J and Daly Lorrie E
Home Financials for this Owner
Home Financials are based on the most recent Mortgage that was taken out on this home.
Original Mortgage
$90,000
Interest Rate
7%
Mortgage Type
Purchase Money Mortgage
Create a Home Valuation Report for This Property
The Home Valuation Report is an in-depth analysis detailing your home's value as well as a comparison with similar homes in the area
Home Values in the Area
Average Home Value in this Area
Purchase History
| Date | Buyer | Sale Price | Title Company |
|---|---|---|---|
| Amado Francisco | $377,000 | -- | |
| Daly Peter J | $230,000 | -- |
Source: Public Records
Mortgage History
| Date | Status | Borrower | Loan Amount |
|---|---|---|---|
| Open | Amado Francisco | $364,417 | |
| Previous Owner | Daly Peter J | $90,000 |
Source: Public Records
Tax History
| Year | Tax Paid | Tax Assessment Tax Assessment Total Assessment is a certain percentage of the fair market value that is determined by local assessors to be the total taxable value of land and additions on the property. | Land | Improvement |
|---|---|---|---|---|
| 2025 | $7,096 | $711,000 | $308,600 | $402,400 |
| 2024 | $6,485 | $684,100 | $285,200 | $398,900 |
| 2023 | $6,224 | $637,700 | $261,800 | $375,900 |
| 2022 | $6,159 | $619,000 | $243,100 | $375,900 |
| 2021 | $5,744 | $577,300 | $224,400 | $352,900 |
| 2020 | $5,349 | $542,500 | $205,700 | $336,800 |
| 2019 | $5,271 | $522,400 | $205,700 | $316,700 |
| 2018 | $5,044 | $478,600 | $177,700 | $300,900 |
| 2017 | $4,844 | $451,000 | $168,300 | $282,700 |
| 2016 | $4,612 | $420,000 | $149,600 | $270,400 |
| 2015 | $4,434 | $400,500 | $140,300 | $260,200 |
| 2014 | $4,276 | $374,400 | $134,600 | $239,800 |
Source: Public Records
Map
Nearby Homes
- 255 River St
- 50 Cleveland Ave
- 30 Church St Unit 4
- 36 Chestnut Ave
- 491 Washington St Unit 1
- 17 White Rd
- 583 Union St
- 5 Woodsum Dr Unit 12
- 6 Oak St
- 298 Lisle St
- 29 Joseph Rd
- 9 Independence Ave Unit 307
- 97 Liberty St
- 31 Doris Rd
- 51 Faxon St
- 192 Federal Ave Unit B
- 125 Allen St Unit A
- 41 Lantern Ln
- 37 Lantern Ln
- 10 Skyline Dr Unit 5