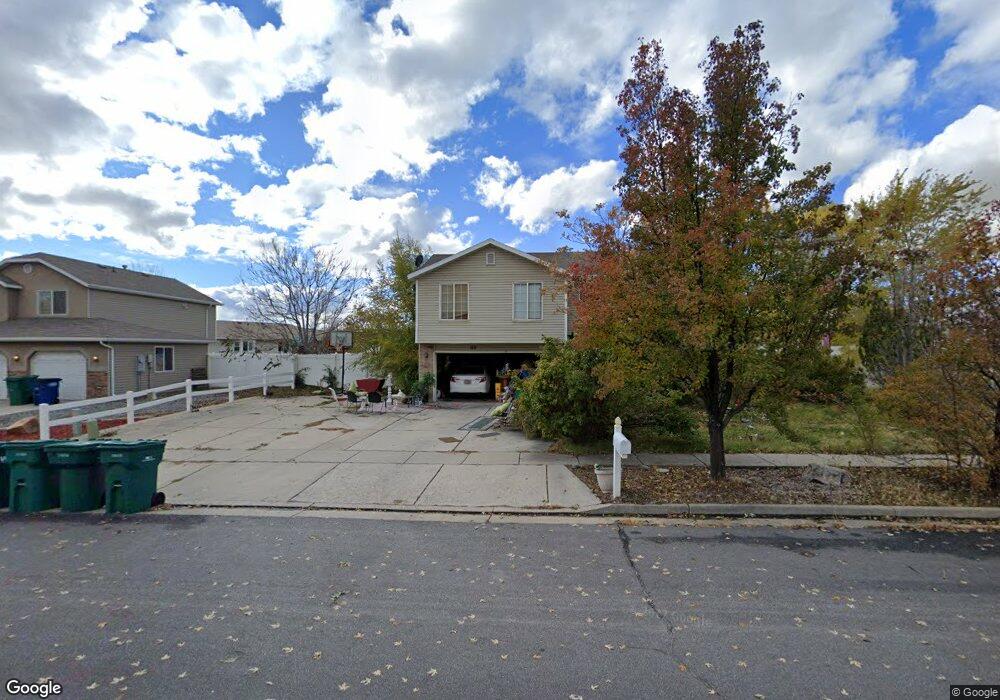
127 N 875 W Clearfield, UT 84015
Estimated Value: $637,000 - $706,000
3
Beds
3
Baths
3,788
Sq Ft
$180/Sq Ft
Est. Value
About This Home
This home is located at 127 N 875 W, Clearfield, UT 84015 and is currently estimated at $683,609, approximately $180 per square foot. 127 N 875 W is a home located in Davis County with nearby schools including Holt Elementary School, North Davis Junior High School, and Syracuse High School.
Ownership History
Date
Name
Owned For
Owner Type
Purchase Details
Closed on
Jan 27, 2017
Sold by
Falkner David E and Falkner Janice H
Bought by
Loomis Leory W and Loomis Shelbie
Current Estimated Value
Home Financials for this Owner
Home Financials are based on the most recent Mortgage that was taken out on this home.
Original Mortgage
$288,000
Outstanding Balance
$238,681
Interest Rate
4.32%
Mortgage Type
New Conventional
Estimated Equity
$444,928
Purchase Details
Closed on
Aug 27, 2011
Sold by
Mike Schultz Construction Inc
Bought by
Falkner David E and Falkner Janice H
Home Financials for this Owner
Home Financials are based on the most recent Mortgage that was taken out on this home.
Original Mortgage
$273,810
Interest Rate
4.48%
Mortgage Type
Unknown
Purchase Details
Closed on
Oct 22, 2009
Sold by
Mdm Development Llc
Bought by
Mike Schultz Construction Inc
Create a Home Valuation Report for This Property
The Home Valuation Report is an in-depth analysis detailing your home's value as well as a comparison with similar homes in the area
Home Values in the Area
Average Home Value in this Area
Purchase History
| Date | Buyer | Sale Price | Title Company |
|---|---|---|---|
| Loomis Leory W | -- | First American Title | |
| Loomis Leory W | -- | First American Title | |
| Falkner David E | -- | Mountain View Title | |
| Mike Schultz Construction Inc | -- | Accommodation | |
| Mike Schultz Construction Inc | -- | Accommodation |
Source: Public Records
Mortgage History
| Date | Status | Borrower | Loan Amount |
|---|---|---|---|
| Open | Loomis Leory W | $288,000 | |
| Closed | Loomis Leory W | $288,000 | |
| Previous Owner | Falkner David E | $273,810 | |
| Previous Owner | Falkner David E | $221,200 |
Source: Public Records
Tax History Compared to Growth
Tax History
| Year | Tax Paid | Tax Assessment Tax Assessment Total Assessment is a certain percentage of the fair market value that is determined by local assessors to be the total taxable value of land and additions on the property. | Land | Improvement |
|---|---|---|---|---|
| 2025 | $4,321 | $387,200 | $82,008 | $305,192 |
| 2024 | $4,094 | $369,600 | $78,357 | $291,243 |
| 2023 | $3,778 | $626,000 | $124,767 | $501,233 |
| 2022 | $4,014 | $359,700 | $70,856 | $288,844 |
| 2021 | $3,449 | $467,000 | $78,531 | $388,469 |
| 2020 | $3,019 | $406,000 | $66,651 | $339,349 |
| 2019 | $2,863 | $380,000 | $67,635 | $312,365 |
| 2018 | $2,691 | $348,000 | $60,033 | $287,967 |
| 2016 | $2,646 | $178,915 | $23,041 | $155,874 |
| 2015 | $2,553 | $164,560 | $23,041 | $141,519 |
| 2014 | $2,227 | $145,470 | $23,041 | $122,429 |
| 2013 | -- | $136,196 | $27,086 | $109,110 |
Source: Public Records
Map
Nearby Homes
- Evergreen Plan at Ivie Meadows
- 274 N 825 W
- 288 N 825 W
- 777 W 300 N
- 232 N Rick Way
- 762 W 300 N
- 168 N 500 W
- 303 N Canterbury Way
- 228 N 500 W
- 482 W 275 N
- 417 N 1200 W Unit 84
- 91 N 500 W
- 561 N 700 W
- 16 N 1300 W
- 423 N 1250 W Unit 118
- 690 Barlow St
- 620 N 1100 W
- 4284 W 350 S Unit 615
- 4296 W 350 S Unit 614
- 853 W 700 N