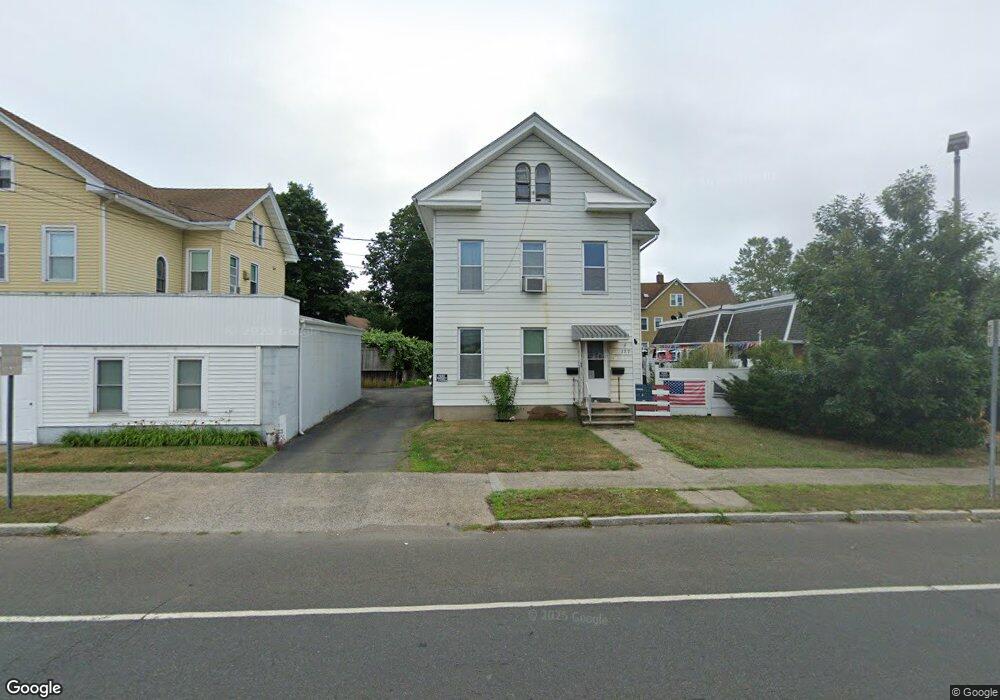
127 N Colony St Wallingford, CT 06492
Estimated Value: $372,925 - $438,000
4
Beds
2
Baths
2,238
Sq Ft
$187/Sq Ft
Est. Value
About This Home
This home is located at 127 N Colony St, Wallingford, CT 06492 and is currently estimated at $419,231, approximately $187 per square foot. 127 N Colony St is a home located in New Haven County with nearby schools including Moses Y Beach Elementary School, Rock Hill Elementary School, and Dag Hammarskjold Middle School.
Ownership History
Date
Name
Owned For
Owner Type
Purchase Details
Closed on
Jul 11, 2013
Sold by
Smith Susan L
Bought by
Whitney James A
Current Estimated Value
Home Financials for this Owner
Home Financials are based on the most recent Mortgage that was taken out on this home.
Original Mortgage
$162,993
Outstanding Balance
$117,663
Interest Rate
3.75%
Mortgage Type
FHA
Estimated Equity
$301,568
Purchase Details
Closed on
Mar 28, 2003
Sold by
Ostrowski David F and Wood Wilbur R
Bought by
Doolittle Robert W and Drost Eleanor
Purchase Details
Closed on
Feb 28, 1994
Sold by
Costa Jack
Bought by
Costa Max
Create a Home Valuation Report for This Property
The Home Valuation Report is an in-depth analysis detailing your home's value as well as a comparison with similar homes in the area
Home Values in the Area
Average Home Value in this Area
Purchase History
| Date | Buyer | Sale Price | Title Company |
|---|---|---|---|
| Whitney James A | $166,000 | -- | |
| Whitney James A | $166,000 | -- | |
| Doolittle Robert W | $200,000 | -- | |
| Doolittle Robert W | $200,000 | -- | |
| Costa Max | $80,000 | -- | |
| Costa Max | $80,000 | -- |
Source: Public Records
Mortgage History
| Date | Status | Borrower | Loan Amount |
|---|---|---|---|
| Open | Costa Max | $162,993 | |
| Closed | Costa Max | $162,993 | |
| Previous Owner | Costa Max | $182,000 |
Source: Public Records
Tax History Compared to Growth
Tax History
| Year | Tax Paid | Tax Assessment Tax Assessment Total Assessment is a certain percentage of the fair market value that is determined by local assessors to be the total taxable value of land and additions on the property. | Land | Improvement |
|---|---|---|---|---|
| 2025 | $5,504 | $228,200 | $61,500 | $166,700 |
| 2024 | $4,317 | $140,800 | $51,200 | $89,600 |
| 2023 | $4,131 | $140,800 | $51,200 | $89,600 |
| 2022 | $4,089 | $140,800 | $51,200 | $89,600 |
| 2021 | $4,016 | $140,800 | $51,200 | $89,600 |
| 2020 | $3,742 | $128,200 | $54,800 | $73,400 |
| 2019 | $3,742 | $128,200 | $54,800 | $73,400 |
| 2018 | $3,672 | $128,200 | $54,800 | $73,400 |
| 2017 | $3,660 | $128,200 | $54,800 | $73,400 |
| 2016 | $3,575 | $128,200 | $54,800 | $73,400 |
| 2015 | $3,522 | $128,200 | $54,800 | $73,400 |
| 2014 | $3,447 | $128,200 | $54,800 | $73,400 |
Source: Public Records
Map
Nearby Homes
- 85 N Colony St
- 148 Judd Square Unit 148
- 67 Spring St
- 49 High St
- 29 Curtis Ave
- 43 Academy St
- 40 Lake St
- 180 S Whittlesey Ave
- 15 Marshall St
- 26 West St
- 39 Hoffman Ct Unit B3
- 212 S Orchard St
- 530 Center St Unit C1
- 91 Marshall St
- 44 3rd St
- 30 Clinton Place
- 109 Clifton St
- 210 S Elm St
- 25 Forest Rd
- 70 N Turnpike Rd Unit 21