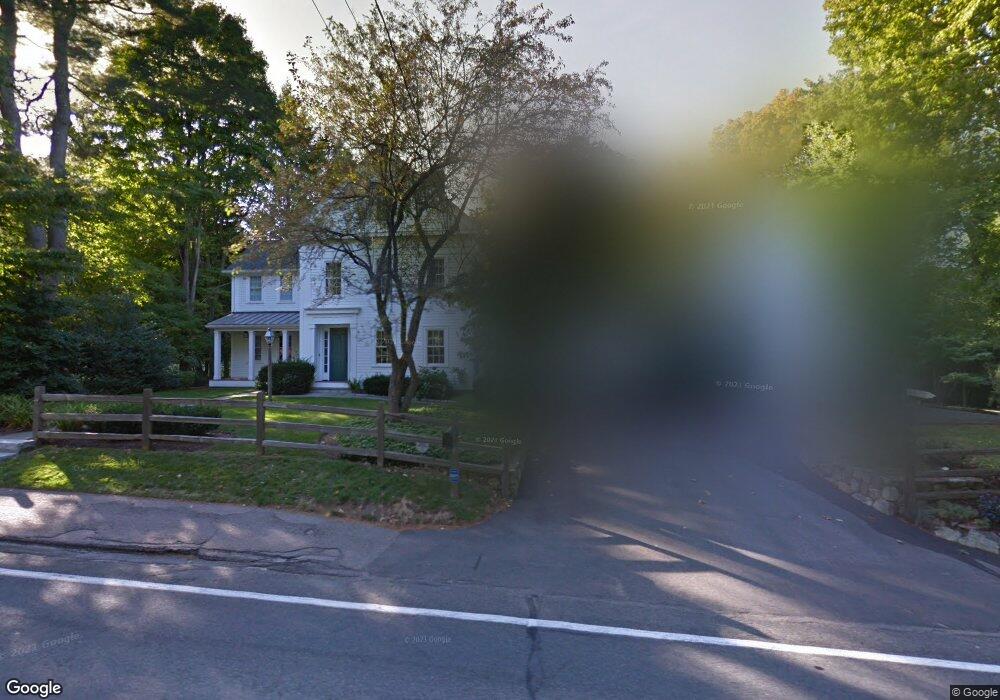
127 N Main St Sherborn, MA 01770
Estimated Value: $1,281,000 - $1,568,000
3
Beds
2
Baths
2,037
Sq Ft
$690/Sq Ft
Est. Value
About This Home
This home is located at 127 N Main St, Sherborn, MA 01770 and is currently estimated at $1,405,064, approximately $689 per square foot. 127 N Main St is a home located in Middlesex County with nearby schools including Pine Hill Elementary School, Dover-Sherborn Regional Middle School, and Dover-Sherborn Regional High School.
Ownership History
Date
Name
Owned For
Owner Type
Purchase Details
Closed on
May 24, 2016
Sold by
Geiger Jonas J and Geiger Sandra S
Bought by
Geiger Sandra S
Current Estimated Value
Purchase Details
Closed on
Dec 30, 2004
Sold by
Hooper Janice B and Hooper Wilford H
Bought by
Geiger Jonas J and Geiger Sandra S
Home Financials for this Owner
Home Financials are based on the most recent Mortgage that was taken out on this home.
Original Mortgage
$250,000
Interest Rate
5.73%
Mortgage Type
Purchase Money Mortgage
Create a Home Valuation Report for This Property
The Home Valuation Report is an in-depth analysis detailing your home's value as well as a comparison with similar homes in the area
Home Values in the Area
Average Home Value in this Area
Purchase History
| Date | Buyer | Sale Price | Title Company |
|---|---|---|---|
| Geiger Sandra S | -- | -- | |
| Geiger Jonas J | $705,000 | -- |
Source: Public Records
Mortgage History
| Date | Status | Borrower | Loan Amount |
|---|---|---|---|
| Previous Owner | Geiger Jonas J | $250,000 |
Source: Public Records
Tax History Compared to Growth
Tax History
| Year | Tax Paid | Tax Assessment Tax Assessment Total Assessment is a certain percentage of the fair market value that is determined by local assessors to be the total taxable value of land and additions on the property. | Land | Improvement |
|---|---|---|---|---|
| 2025 | $21,584 | $1,301,800 | $365,100 | $936,700 |
| 2024 | $21,111 | $1,245,500 | $307,600 | $937,900 |
| 2023 | $19,833 | $1,101,200 | $307,600 | $793,600 |
| 2022 | $18,275 | $960,300 | $307,000 | $653,300 |
| 2021 | $18,851 | $960,300 | $307,000 | $653,300 |
| 2020 | $18,073 | $928,700 | $307,000 | $621,700 |
| 2019 | $17,601 | $897,100 | $307,000 | $590,100 |
| 2018 | $17,314 | $897,100 | $307,000 | $590,100 |
| 2017 | $16,661 | $814,300 | $291,900 | $522,400 |
| 2016 | $16,750 | $814,300 | $291,900 | $522,400 |
| 2015 | $16,429 | $808,500 | $283,900 | $524,600 |
| 2014 | $16,288 | $800,800 | $266,900 | $533,900 |
Source: Public Records
Map
Nearby Homes