
Estimated payment $120/month
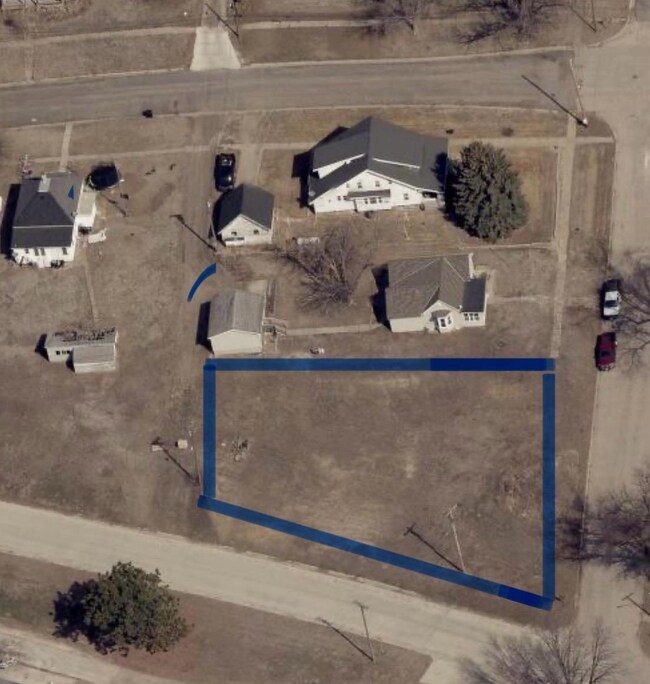
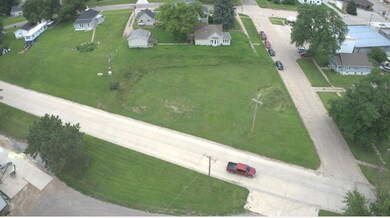
About This Lot
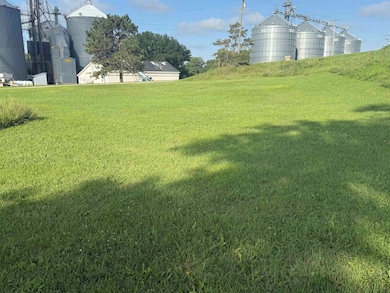
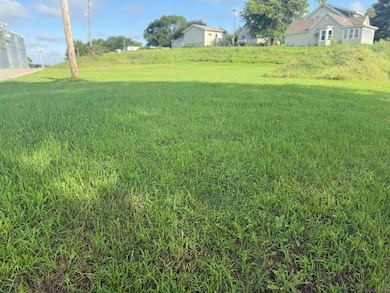
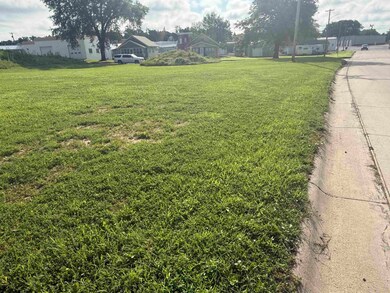
Take a stroll down Oak Street and picture your stunning dream home on this spacious corner lot, within walking distance to downtown. I’m here to help you with your real estate goals...starting from the ground up! *the dirt/grass mound on the east side of the property has a water main in it. Once a buyer starts to develop the property, the city will come & bury it.
Property Details
Property Type
- Land
Est. Annual Taxes
- $80
Lot Details
- Corner Lot
- Level Lot
Additional Homes
- Residence on Property
Listing and Financial Details
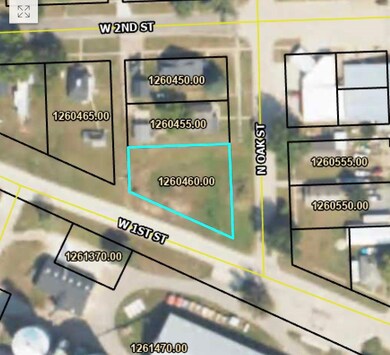
- Assessor Parcel Number 1260460
Map
Home Values in the Area
Average Home Value in this Area
Tax History
| Year | Tax Paid | Tax Assessment Tax Assessment Total Assessment is a certain percentage of the fair market value that is determined by local assessors to be the total taxable value of land and additions on the property. | Land | Improvement |
|---|---|---|---|---|
| 2025 | $80 | $5,810 | $5,810 | $0 |
| 2024 | $80 | $5,810 | $5,810 | $0 |
| 2023 | $103 | $5,810 | $5,810 | $0 |
| 2022 | $109 | $5,810 | $5,810 | $0 |
| 2021 | $106 | $5,810 | $5,810 | $0 |
| 2020 | $104 | $5,810 | $5,810 | $0 |
| 2019 | $60 | $3,485 | $3,485 | $0 |
| 2018 | $230 | $13,590 | $3,485 | $10,105 |
| 2017 | $450 | $26,465 | $3,485 | $22,980 |
| 2016 | $606 | $35,705 | $3,485 | $32,220 |
| 2015 | $581 | $35,705 | $3,485 | $32,220 |
| 2014 | $735 | $35,705 | $3,485 | $32,220 |
Property History
| Date | Event | Price | List to Sale | Price per Sq Ft |
|---|---|---|---|---|
| 10/27/2025 10/27/25 | Price Changed | $21,500 | -14.0% | -- |
| 07/17/2025 07/17/25 | For Sale | $25,000 | -- | -- |
Source: Norfolk Board of REALTORS®
MLS Number: 250534
APN: 1260460.00
Disclaimer: Certain information contained herein is derived from information provided by parties other than Homes.com. All information provided is deemed reliable, but is not guaranteed to be accurate and should be independently verified.
![]() IDX information is provided exclusively for personal, non-commercial use, and may not be used for any purpose other than to identify prospective properties consumers may be interested in purchasing. Information is deemed reliable but not guaranteed.
IDX information is provided exclusively for personal, non-commercial use, and may not be used for any purpose other than to identify prospective properties consumers may be interested in purchasing. Information is deemed reliable but not guaranteed.
- 219 E Short St
- 325 N Main St
- 0 See Legal Address- Stanton Parcel 3740 03 Unit 250844
- 517 W 3rd St
- 251 1st St
- 711 Main St
- 223 S 6th St
- 218 N 6th St
- 83148 563rd Ave
- 223 S 2nd St
- 203 Maple St
- 51636 280th Ave
- 306 N 5th St
- 301 Main St
- 609 Sunshine Ave
- 30166 190th Ave
- 104 W 14th St
- 106 W 14th St
- 108 W 14th St
- 701 E 2nd St
