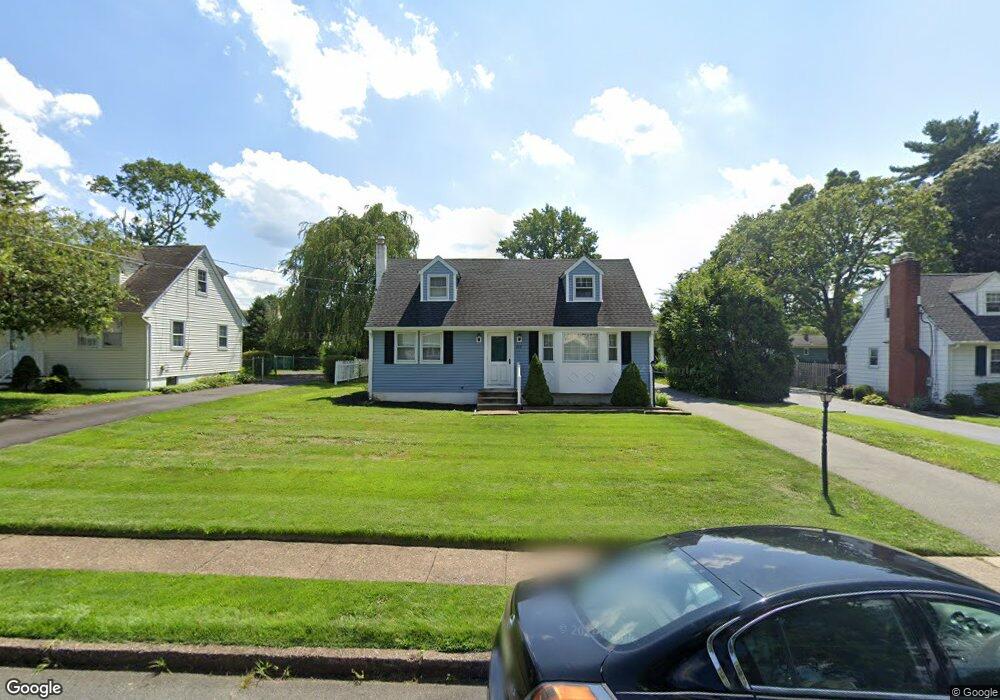
127 Nancy Ln Ewing, NJ 08638
Ewingville NeighborhoodEstimated Value: $372,000 - $462,000
4
Beds
2
Baths
1,545
Sq Ft
$277/Sq Ft
Est. Value
About This Home
This home is located at 127 Nancy Ln, Ewing, NJ 08638 and is currently estimated at $428,173, approximately $277 per square foot. 127 Nancy Ln is a home located in Mercer County with nearby schools including Ewing High School, Trenton Stem-To-Civics Charter School, and Guidepost Montessori at Lawrenceville.
Ownership History
Date
Name
Owned For
Owner Type
Purchase Details
Closed on
Feb 24, 2020
Sold by
Greiss Mina and Greiss Angele T
Bought by
Greiss Mina and Greiss Jessica
Current Estimated Value
Home Financials for this Owner
Home Financials are based on the most recent Mortgage that was taken out on this home.
Original Mortgage
$162,000
Outstanding Balance
$143,745
Interest Rate
3.6%
Mortgage Type
New Conventional
Estimated Equity
$284,428
Purchase Details
Closed on
Apr 25, 2011
Sold by
Greene Christopher and Greene Dhana R
Bought by
Greiss Mina and Greiss Angele T
Purchase Details
Closed on
Sep 15, 1998
Sold by
Lewis David
Bought by
Greene Dhana
Home Financials for this Owner
Home Financials are based on the most recent Mortgage that was taken out on this home.
Original Mortgage
$123,300
Interest Rate
6.9%
Purchase Details
Closed on
Apr 30, 1993
Sold by
Lanigan Joseph P and Lanigan Eileen R
Bought by
Lewis David W and Lewis Janice L
Create a Home Valuation Report for This Property
The Home Valuation Report is an in-depth analysis detailing your home's value as well as a comparison with similar homes in the area
Home Values in the Area
Average Home Value in this Area
Purchase History
| Date | Buyer | Sale Price | Title Company |
|---|---|---|---|
| Greiss Mina | -- | Cta Title Services Llc | |
| Greiss Mina | $160,000 | None Available | |
| Greene Dhana | $137,000 | -- | |
| Lewis David W | $140,000 | -- |
Source: Public Records
Mortgage History
| Date | Status | Borrower | Loan Amount |
|---|---|---|---|
| Open | Greiss Mina | $162,000 | |
| Previous Owner | Greene Dhana | $123,300 |
Source: Public Records
Tax History
| Year | Tax Paid | Tax Assessment Tax Assessment Total Assessment is a certain percentage of the fair market value that is determined by local assessors to be the total taxable value of land and additions on the property. | Land | Improvement |
|---|---|---|---|---|
| 2025 | $8,912 | $226,600 | $79,400 | $147,200 |
| 2024 | $8,377 | $226,600 | $79,400 | $147,200 |
Source: Public Records
Map
Nearby Homes
- 438 Ewingville Rd
- 4 David Dr
- 71 Bakun Way
- 347 Green Ln
- 34 Lopatcong Dr
- 2148 Pennington Rd
- 42 Running Brook Rd
- 4 Blossom Dr
- 23 Sundew Dr
- 256 Ewingville Rd
- 2 Sparrow Ct
- 513 Eggerts Crossing Rd
- 138 Tulip Ln
- 40 Arden Ave
- 140 Crescent Ave
- 370 Eggerts Crossing Rd
- 89 Upper Ferry Rd
- 6 Van Gogh Ct
- 53 Carlton Ave
- 13 Hickory Hill Dr
Your Personal Tour Guide
Ask me questions while you tour the home.