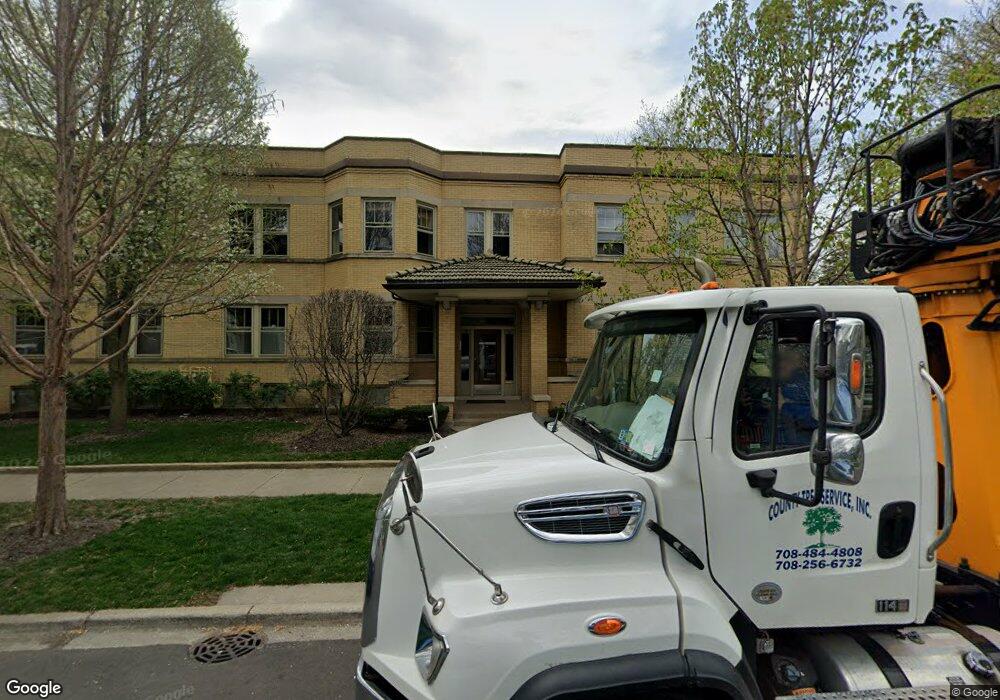
127 Pleasant St Unit 127G Oak Park, IL 60302
Estimated Value: $195,000 - $207,000
2
Beds
1
Bath
950
Sq Ft
$212/Sq Ft
Est. Value
About This Home
This home is located at 127 Pleasant St Unit 127G, Oak Park, IL 60302 and is currently estimated at $201,178, approximately $211 per square foot. 127 Pleasant St Unit 127G is a home located in Cook County with nearby schools including William Beye Elementary School, Percy Julian Middle School, and Oak Park and River Forest High School.
Ownership History
Date
Name
Owned For
Owner Type
Purchase Details
Closed on
Dec 3, 2021
Sold by
Cousin Julius
Bought by
Kidd Anthony
Current Estimated Value
Home Financials for this Owner
Home Financials are based on the most recent Mortgage that was taken out on this home.
Original Mortgage
$120,000
Outstanding Balance
$110,339
Interest Rate
3.09%
Mortgage Type
New Conventional
Estimated Equity
$90,839
Purchase Details
Closed on
Sep 23, 2016
Sold by
Mazariegos Oscar
Bought by
Cousin Julius
Home Financials for this Owner
Home Financials are based on the most recent Mortgage that was taken out on this home.
Original Mortgage
$137,750
Interest Rate
3.45%
Mortgage Type
New Conventional
Purchase Details
Closed on
Aug 5, 2013
Sold by
Federal Home Loan Mortgage Corporation
Bought by
Mazariegos Oscar R
Purchase Details
Closed on
Aug 1, 2012
Sold by
Flanagan Erin
Bought by
Federal Home Loan Mortgage Corporation
Create a Home Valuation Report for This Property
The Home Valuation Report is an in-depth analysis detailing your home's value as well as a comparison with similar homes in the area
Home Values in the Area
Average Home Value in this Area
Purchase History
| Date | Buyer | Sale Price | Title Company |
|---|---|---|---|
| Kidd Anthony | $160,000 | Attorney | |
| Cousin Julius | $145,000 | Chicago Title Insurance Comp | |
| Mazariegos Oscar R | $59,000 | Attorneys Title Guaranty Fun | |
| Federal Home Loan Mortgage Corporation | -- | None Available |
Source: Public Records
Mortgage History
| Date | Status | Borrower | Loan Amount |
|---|---|---|---|
| Open | Kidd Anthony | $120,000 | |
| Previous Owner | Cousin Julius | $137,750 |
Source: Public Records
Tax History Compared to Growth
Tax History
| Year | Tax Paid | Tax Assessment Tax Assessment Total Assessment is a certain percentage of the fair market value that is determined by local assessors to be the total taxable value of land and additions on the property. | Land | Improvement |
|---|---|---|---|---|
| 2024 | $4,505 | $13,820 | $1,770 | $12,050 |
| 2023 | $4,982 | $13,820 | $1,770 | $12,050 |
| 2022 | $4,982 | $12,975 | $1,012 | $11,963 |
| 2021 | $3,608 | $12,973 | $1,011 | $11,962 |
| 2020 | $3,603 | $12,973 | $1,011 | $11,962 |
| 2019 | $5,022 | $13,090 | $916 | $12,174 |
| 2018 | $4,834 | $13,090 | $916 | $12,174 |
| 2017 | $5,289 | $14,643 | $916 | $13,727 |
| 2016 | $4,486 | $11,147 | $758 | $10,389 |
| 2015 | $4,020 | $11,147 | $758 | $10,389 |
| 2014 | $3,735 | $11,147 | $758 | $10,389 |
| 2013 | $3,874 | $16,412 | $758 | $15,654 |
Source: Public Records
Map
Nearby Homes
- 136 S Taylor Ave
- 255 South Blvd Unit 7
- 222 Washington Blvd Unit P14
- 316 N Austin Blvd
- 402 S Lombard Ave Unit 3
- 307 South Blvd
- 143 N Taylor Ave
- 241 Washington Blvd Unit G
- 243 Washington Blvd Unit 3A
- 426 S Lombard Ave Unit 205
- 229 S Ridgeland Ave
- 433 S Lombard Ave Unit 33
- 331 S Ridgeland Ave Unit B
- 216 N Mayfield Ave
- 129 N Mason Ave Unit 105
- 118 N Mayfield Ave
- 444 Washington Blvd Unit 207
- 444 Washington Blvd Unit 406
- 108 S Scoville Ave Unit 2C
- 514 S Humphrey Ave
- 127 Pleasant St Unit 127B
- 127 Pleasant St Unit 127A
- 127 Pleasant St Unit B
- 127 Pleasant St
- 125 Pleasant St Unit P11
- 125 Pleasant St Unit 125B
- 125 Pleasant St Unit 125A
- 125 Pleasant St Unit B
- 125 Pleasant St Unit A
- 206 S Lombard Ave Unit G2
- 206 S Lombard Ave Unit 206A
- 206 S Lombard Ave Unit G6
- 206 S Lombard Ave Unit B
- 206 S Lombard Ave Unit A
- 119 S Lombard Ave Unit 4
- 121 Pleasant St Unit 121B
- 121 Pleasant St Unit 121A
- 121 Pleasant St Unit A
- 121 Pleasant St Unit B
- 208 S Lombard Ave Unit 208A