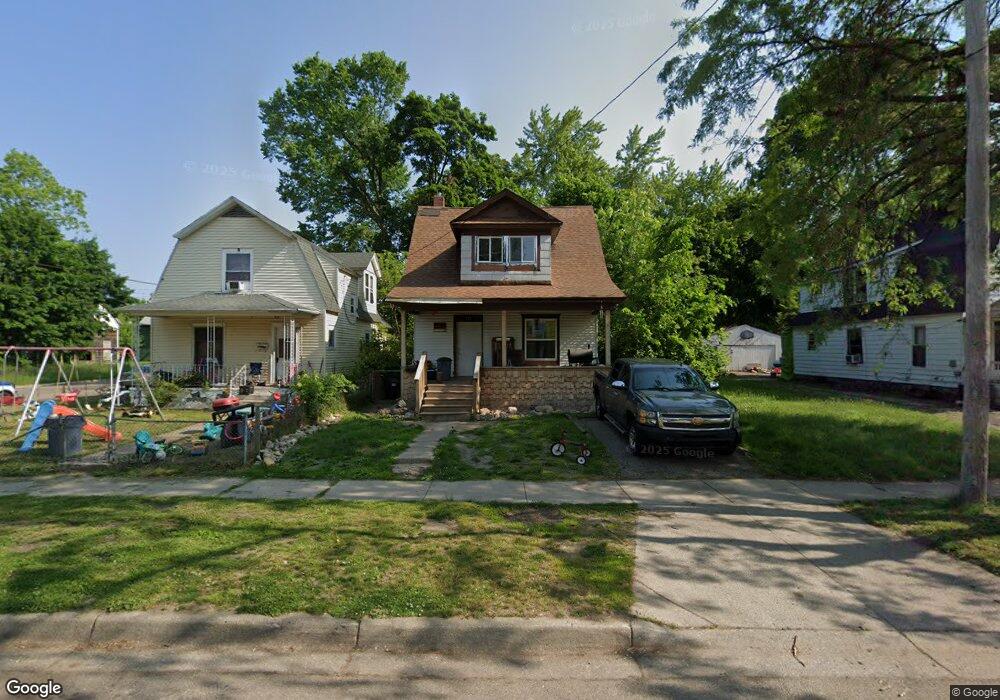
127 Post Ave Battle Creek, MI 49014
Post Franklin NeighborhoodEstimated Value: $71,828 - $98,000
2
Beds
1
Bath
792
Sq Ft
$111/Sq Ft
Est. Value
About This Home
This home is located at 127 Post Ave, Battle Creek, MI 49014 and is currently estimated at $87,707, approximately $110 per square foot. 127 Post Ave is a home located in Calhoun County with nearby schools including Post-Franklin Elementary School, Springfield Middle School, and Battle Creek Central High School.
Ownership History
Date
Name
Owned For
Owner Type
Purchase Details
Closed on
Nov 16, 2017
Sold by
Camisa Eleanor and Linell Gustave A
Bought by
Wiegand Karl and Wiegand Paul
Current Estimated Value
Purchase Details
Closed on
Nov 6, 2012
Sold by
Mapes Michael
Bought by
Camisa Eleanor J
Purchase Details
Closed on
Dec 27, 2010
Sold by
Camisa Eleanor J
Bought by
Mapes Michael
Purchase Details
Closed on
Oct 16, 2009
Sold by
Camisa Eleanor J and Camisa Eleanor
Bought by
Linell Gustave A and Camisa Eleanor J
Create a Home Valuation Report for This Property
The Home Valuation Report is an in-depth analysis detailing your home's value as well as a comparison with similar homes in the area
Home Values in the Area
Average Home Value in this Area
Purchase History
| Date | Buyer | Sale Price | Title Company |
|---|---|---|---|
| Wiegand Karl | $8,500 | Primary Title | |
| Camisa Eleanor J | -- | None Available | |
| Mapes Michael | $260,000 | None Available | |
| Linell Gustave A | -- | None Available |
Source: Public Records
Mortgage History
| Date | Status | Borrower | Loan Amount |
|---|---|---|---|
| Closed | Mapes Michael | $0 |
Source: Public Records
Tax History
| Year | Tax Paid | Tax Assessment Tax Assessment Total Assessment is a certain percentage of the fair market value that is determined by local assessors to be the total taxable value of land and additions on the property. | Land | Improvement |
|---|---|---|---|---|
| 2025 | -- | $20,700 | $0 | $0 |
| 2024 | $209 | $17,269 | $0 | $0 |
| 2023 | $655 | $15,760 | $0 | $0 |
| 2022 | $465 | $13,005 | $0 | $0 |
| 2021 | $622 | $11,901 | $0 | $0 |
| 2020 | $586 | $11,784 | $0 | $0 |
| 2019 | $508 | $9,698 | $0 | $0 |
| 2018 | $508 | $9,060 | $330 | $8,730 |
| 2017 | $440 | $11,104 | $0 | $0 |
| 2016 | $439 | $9,515 | $0 | $0 |
| 2015 | $415 | $11,861 | $1,638 | $10,223 |
| 2014 | $415 | $9,011 | $1,638 | $7,373 |
Source: Public Records
Map
Nearby Homes
Your Personal Tour Guide
Ask me questions while you tour the home.