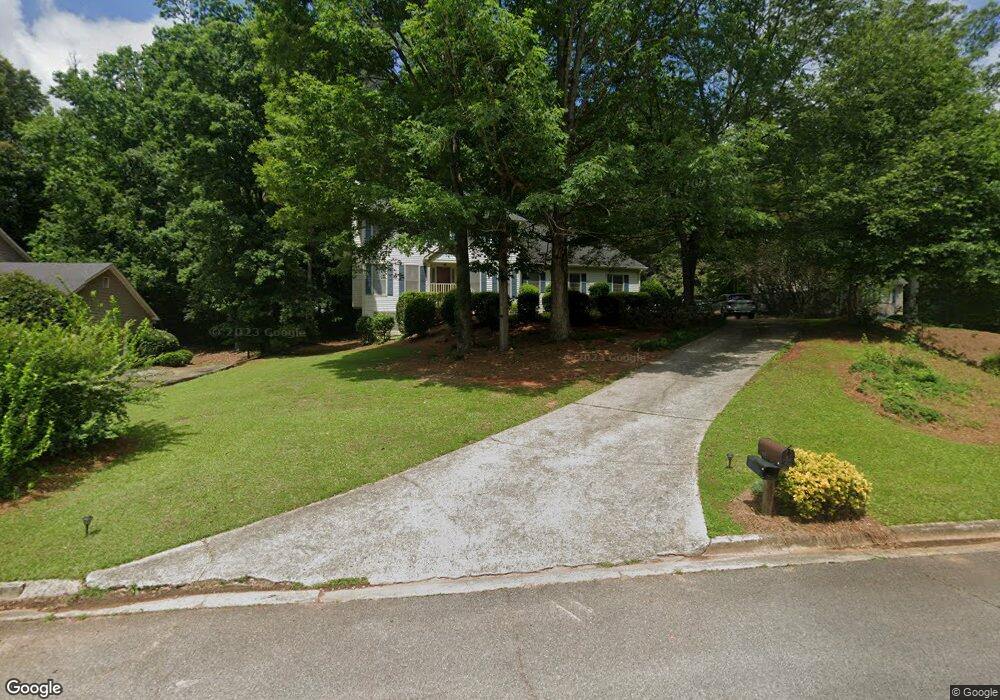
127 Rivoli Oaks Cir Macon, GA 31210
Estimated Value: $265,000 - $346,000
3
Beds
3
Baths
1,934
Sq Ft
$152/Sq Ft
Est. Value
About This Home
This home is located at 127 Rivoli Oaks Cir, Macon, GA 31210 and is currently estimated at $293,450, approximately $151 per square foot. 127 Rivoli Oaks Cir is a home located in Bibb County with nearby schools including Springdale Elementary School, Howard Middle School, and Howard High School.
Ownership History
Date
Name
Owned For
Owner Type
Purchase Details
Closed on
Nov 3, 2021
Sold by
Fordham Amanda Jean
Bought by
Fordham Amanda Jean and Askew Stephen E
Current Estimated Value
Purchase Details
Closed on
Apr 9, 2021
Sold by
Baldwin Dylan Ray and Baldwin Ashley Valery
Bought by
Fordham Amanda Jean
Home Financials for this Owner
Home Financials are based on the most recent Mortgage that was taken out on this home.
Original Mortgage
$206,097
Outstanding Balance
$184,962
Interest Rate
2.9%
Mortgage Type
FHA
Estimated Equity
$108,488
Purchase Details
Closed on
Nov 5, 2020
Sold by
Lyles James E and Lyles Catherine Bennett
Bought by
Baldwin Dylan Ray and Baldwin Ashley Valery
Purchase Details
Closed on
Nov 3, 2020
Sold by
Baldwin Dylan Ray and Baldwin Ashley Valery
Bought by
Sunmark Community Bank
Purchase Details
Closed on
Mar 9, 2005
Sold by
Madison Patrick James and Madison Jane M
Bought by
Lyles James E and Lyles Catherine Bennett
Create a Home Valuation Report for This Property
The Home Valuation Report is an in-depth analysis detailing your home's value as well as a comparison with similar homes in the area
Home Values in the Area
Average Home Value in this Area
Purchase History
| Date | Buyer | Sale Price | Title Company |
|---|---|---|---|
| Fordham Amanda Jean | -- | None Available | |
| Fordham Amanda Jean | $215,000 | None Available | |
| Baldwin Dylan Ray | $78,000 | None Available | |
| Sunmark Community Bank | $95,000 | None Available | |
| Lyles James E | $178,000 | None Available |
Source: Public Records
Mortgage History
| Date | Status | Borrower | Loan Amount |
|---|---|---|---|
| Open | Fordham Amanda Jean | $206,097 |
Source: Public Records
Tax History Compared to Growth
Tax History
| Year | Tax Paid | Tax Assessment Tax Assessment Total Assessment is a certain percentage of the fair market value that is determined by local assessors to be the total taxable value of land and additions on the property. | Land | Improvement |
|---|---|---|---|---|
| 2025 | $2,155 | $94,705 | $14,000 | $80,705 |
| 2024 | $2,227 | $94,705 | $14,000 | $80,705 |
| 2023 | $2,405 | $94,705 | $14,000 | $80,705 |
| 2022 | $2,977 | $91,547 | $12,123 | $79,424 |
| 2021 | $2,976 | $78,309 | $12,123 | $66,186 |
| 2020 | $2,545 | $65,563 | $11,546 | $54,017 |
| 2019 | $2,566 | $65,563 | $11,546 | $54,017 |
| 2018 | $4,110 | $65,563 | $11,546 | $54,017 |
| 2017 | $2,456 | $65,563 | $11,546 | $54,017 |
| 2016 | $2,268 | $65,563 | $11,546 | $54,017 |
| 2015 | $2,847 | $65,120 | $11,546 | $53,574 |
| 2014 | $950 | $65,120 | $11,546 | $53,574 |
Source: Public Records
Map
Nearby Homes
- 5369 Rivoli Dr
- 5341 Northside Dr
- 181 Rivoli Landing
- 137 Senora Place
- 1231 Woodcrest Dr
- 757 Silver Springs Dr
- 1021 Bass Rd
- 115 Saddle Run Ct
- 123 Saddle Run Ct
- 178 Springfield Blvd
- 5161 Wesleyan Cir
- 567 Billingswood Dr
- 199 Springfield Blvd
- 171 Lake View Dr N
- 150 Springdale Ct
- 100 S Haven Ct
- 5104 Pine Ridge Dr
- 578 Edgefield Way
- 108 Hillbrooke Ct
- 618 Millrun Ct
- 129 Rivoli Oaks Cir
- 125 Rivoli Oaks Cir
- 125 Rivoli Oaks Cir Unit 54
- 131 Rivoli Oaks Cir
- 121 Carriage Way
- 123 Rivoli Oaks Cir
- 117 Carriage Way
- 120 Rivoli Oaks Cir
- 125 Carriage Way
- 121 Rivoli Oaks Cir
- 128 Rivoli Oaks Cir
- 133 Rivoli Oaks Cir
- 113 Carriage Way
- 113 Carriage Way Unit 27911
- 130 Rivoli Oaks Cir
- 119 Rivoli Oaks Cir
- 129 Carriage Way
- 135 Rivoli Oaks Cir
- 116 Rivoli Oaks Cir
- 109 Carriage Way