127 Robertson Rd Lagrange, GA 30241
Estimated Value: $226,241 - $257,000
3
Beds
2
Baths
1,564
Sq Ft
$153/Sq Ft
Est. Value
About This Home
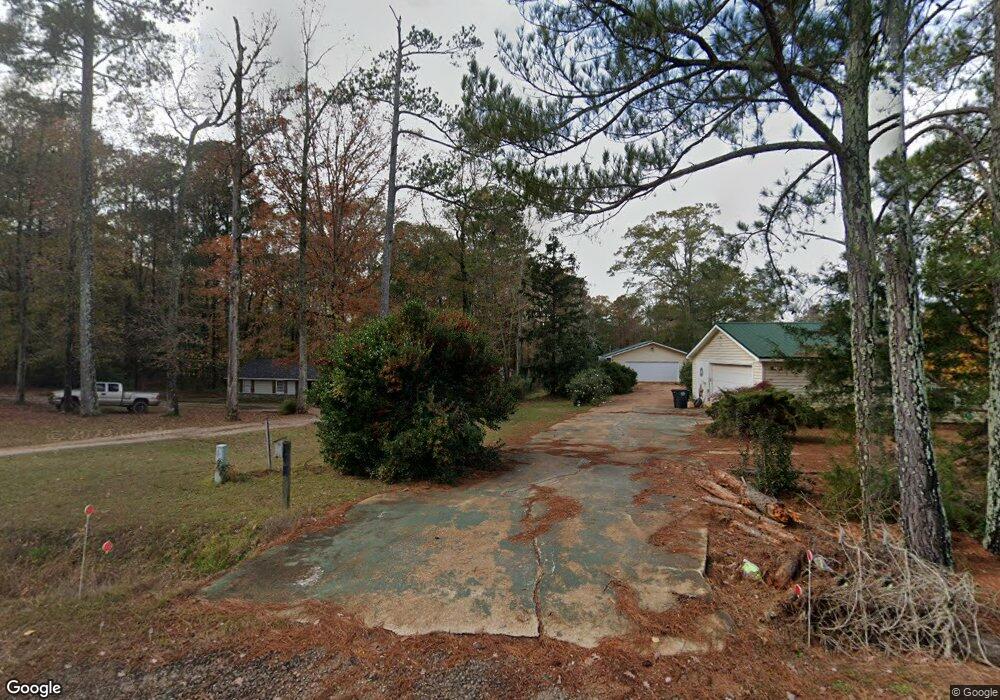
This home is located at 127 Robertson Rd, Lagrange, GA 30241 and is currently estimated at $240,060, approximately $153 per square foot. 127 Robertson Rd is a home located in Troup County with nearby schools including Rosemont Elementary School, Whitesville Road Elementary School, and Berta Weathersbee Elementary School.
Ownership History
Date
Name
Owned For
Owner Type
Purchase Details
Closed on
Oct 23, 2009
Sold by
Smith Tina M
Bought by
Carlisle Kelly M
Current Estimated Value
Home Financials for this Owner
Home Financials are based on the most recent Mortgage that was taken out on this home.
Original Mortgage
$101,938
Outstanding Balance
$65,509
Interest Rate
5.01%
Mortgage Type
New Conventional
Estimated Equity
$174,551
Purchase Details
Closed on
Feb 27, 2007
Sold by
Smith Michael T
Bought by
Smith Tina M
Purchase Details
Closed on
May 31, 1994
Sold by
David O Griffin
Bought by
Smith Micheal T
Purchase Details
Closed on
Oct 6, 1986
Bought by
David O Griffin
Purchase Details
Closed on
Aug 8, 1977
Purchase Details
Closed on
Jan 27, 1975
Purchase Details
Closed on
Jan 1, 1973
Create a Home Valuation Report for This Property
The Home Valuation Report is an in-depth analysis detailing your home's value as well as a comparison with similar homes in the area
Purchase History
| Date | Buyer | Sale Price | Title Company |
|---|---|---|---|
| Carlisle Kelly M | $99,900 | -- | |
| Carlisle Kelly M | $99,900 | -- | |
| Smith Tina M | -- | -- | |
| Smith Micheal T | $54,000 | -- | |
| David O Griffin | $48,600 | -- | |
| David O Griffin | $48,600 | -- | |
| -- | $36,800 | -- | |
| -- | $31,000 | -- | |
| -- | $3,000 | -- |
Source: Public Records
Mortgage History
| Date | Status | Borrower | Loan Amount |
|---|---|---|---|
| Open | Carlisle Kelly M | $101,938 | |
| Closed | Carlisle Kelly M | $101,938 |
Source: Public Records
Tax History
| Year | Tax Paid | Tax Assessment Tax Assessment Total Assessment is a certain percentage of the fair market value that is determined by local assessors to be the total taxable value of land and additions on the property. | Land | Improvement |
|---|---|---|---|---|
| 2025 | $2,005 | $73,520 | $12,000 | $61,520 |
| 2024 | $1,803 | $66,120 | $12,000 | $54,120 |
| 2023 | $1,366 | $50,080 | $12,000 | $38,080 |
| 2022 | $1,334 | $47,800 | $12,000 | $35,800 |
| 2021 | $1,126 | $37,320 | $9,600 | $27,720 |
| 2020 | $1,126 | $37,320 | $9,600 | $27,720 |
| 2019 | $1,177 | $39,040 | $9,600 | $29,440 |
| 2018 | $1,097 | $36,360 | $9,600 | $26,760 |
| 2017 | $1,097 | $36,360 | $9,600 | $26,760 |
| 2016 | $987 | $32,726 | $9,780 | $22,946 |
| 2015 | $989 | $32,726 | $9,780 | $22,946 |
| 2014 | $954 | $31,519 | $9,780 | $21,739 |
| 2013 | -- | $35,964 | $9,780 | $26,184 |
Source: Public Records
Map
Nearby Homes
- 137 Robertson Rd
- 130 Hamilton Lake Dr
- 2851 & 2891 Hamilton Rd
- 950 John Lovelace Rd
- 111 Prestwick Dr
- 11.59+/- AC Hunt Rd
- 0 Briley Rd Unit 10582531
- 0 Briley Rd Unit 214353
- 830 John Lovelace Rd
- 246 S Smith Rd
- 113 Glenn Eagle Point
- 209 Grace Ct
- 557 Lago Ct
- 501 Lago Ct
- 123 Wexford Dr
- 312 Lana Ln
- 329 Linman Dr
- 405 Lakeview Way
- 414 Lakeview Way
- 1751 Smokey Rd
- 131 Robertson Rd
- 123 Robertson Rd
- 133 Robertson Rd
- 121 Robertson Rd
- 126 Robertson Rd
- 124 Robertson Rd
- 117 Robertson Rd
- 120 Robertson Rd
- 122 Robertson Rd
- 118 Robertson Rd
- 3879 Hamilton Rd
- 115 Robertson Rd
- 141 Robertson Rd
- 116 Robertson Rd
- 111 Robertson Rd
- 139 Robertson Rd
- 139 1/2 Robertson Rd
- 143 Robertson Rd
- 109 Robertson Rd
- 107 Robertson Rd
Your Personal Tour Guide
Ask me questions while you tour the home.