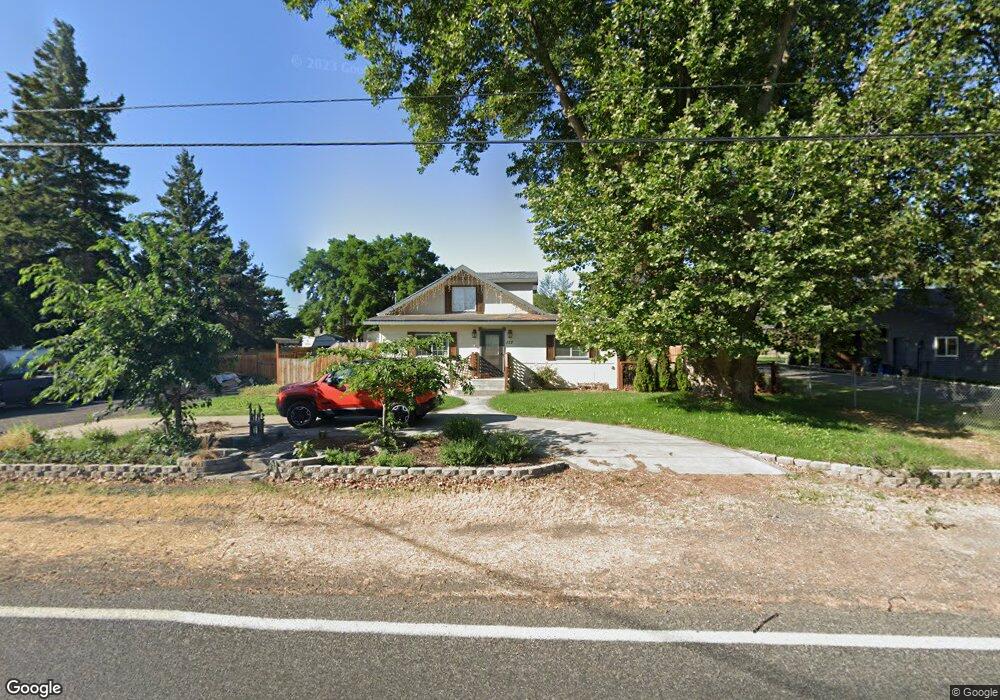
127 S Highland Dr Unit Back On The Market! Kennewick, WA 99337
Estimated Value: $402,333 - $518,000
3
Beds
2
Baths
1,608
Sq Ft
$276/Sq Ft
Est. Value
About This Home
This home is located at 127 S Highland Dr Unit Back On The Market!, Kennewick, WA 99337 and is currently estimated at $443,333, approximately $275 per square foot. 127 S Highland Dr Unit Back On The Market! is a home located in Benton County with nearby schools including Cascade Elementary School, Horse Heaven Hills Middle School, and Kennewick High School.
Ownership History
Date
Name
Owned For
Owner Type
Purchase Details
Closed on
Apr 17, 2018
Sold by
Sutherland Carl A and Sutherland Kristina S
Bought by
Covey James C and Covey Shannon Leann
Current Estimated Value
Home Financials for this Owner
Home Financials are based on the most recent Mortgage that was taken out on this home.
Original Mortgage
$243,998
Outstanding Balance
$210,126
Interest Rate
4.5%
Mortgage Type
FHA
Estimated Equity
$233,207
Purchase Details
Closed on
Dec 11, 2013
Sold by
Schmidt Keith L
Bought by
Sutherland Carl A and Sutherland Kristina S
Home Financials for this Owner
Home Financials are based on the most recent Mortgage that was taken out on this home.
Original Mortgage
$164,972
Interest Rate
4.13%
Mortgage Type
VA
Create a Home Valuation Report for This Property
The Home Valuation Report is an in-depth analysis detailing your home's value as well as a comparison with similar homes in the area
Home Values in the Area
Average Home Value in this Area
Purchase History
| Date | Buyer | Sale Price | Title Company |
|---|---|---|---|
| Covey James C | $248,500 | Ticor Title Co | |
| Sutherland Carl A | $161,500 | Tri City Title & Escrow |
Source: Public Records
Mortgage History
| Date | Status | Borrower | Loan Amount |
|---|---|---|---|
| Open | Covey James C | $243,998 | |
| Previous Owner | Sutherland Carl A | $164,972 |
Source: Public Records
Tax History Compared to Growth
Tax History
| Year | Tax Paid | Tax Assessment Tax Assessment Total Assessment is a certain percentage of the fair market value that is determined by local assessors to be the total taxable value of land and additions on the property. | Land | Improvement |
|---|---|---|---|---|
| 2024 | $2,508 | $349,470 | $70,000 | $279,470 |
| 2023 | $2,508 | $312,200 | $70,000 | $242,200 |
| 2022 | $2,287 | $256,310 | $70,000 | $186,310 |
| 2021 | $2,305 | $232,920 | $50,000 | $182,920 |
| 2020 | $2,408 | $227,840 | $50,000 | $177,840 |
| 2019 | $1,317 | $227,840 | $50,000 | $177,840 |
| 2018 | $1,570 | $126,020 | $50,000 | $76,020 |
| 2017 | $1,553 | $122,710 | $50,000 | $72,710 |
| 2016 | $1,920 | $133,190 | $45,000 | $88,190 |
| 2015 | $1,746 | $133,190 | $45,000 | $88,190 |
| 2014 | -- | $118,190 | $30,000 | $88,190 |
| 2013 | -- | $118,190 | $30,000 | $88,190 |
Source: Public Records
Map
Nearby Homes
- NKA S Elm Place
- 4108 S Auburn St
- 108 W 45th Ave
- 4209 S Cascade St
- 4505 S Dayton Ct
- 207 W 48th Ave
- 106 E 36th Ave
- 3628 S Date St
- TBD Parcel 118802020001004 & 118802020003004
- 4805 S Jean St
- 900 W 44th Place
- 3403 S Hartford St
- 4004 S Jean St
- 4202 S Kent St
- 4119 S Kingwood St Unit Lot 7
- 4131 S Kingwood St Unit Lot 6
- 4155 S Kingwood St Unit Lot 4
- 4179 S Kingwood St Unit Lot 2
- 2920 S Everett St
- 2816 S Cedar St
- 127 S Highland Dr Unit Completey Remodeled
- 127 S Highland Dr
- 159 S Highland Dr
- Lot 9 Sunrise Ridge
- 101 S Highland Dr
- 114 S Highland Dr
- 101 S Undetermined Dr
- 122 S Highland Dr
- 111 S Highland Dr
- Lot 13 Sunrise Ridge
- 94126 E 82 Prse
- 94126 E 82 Prairie SE
- 7 S Highland Dr
- 4 S Highland Dr
- 4116 S Auburn St
- 4205 S Auburn St
- 4306 S Washington St
- 3 S Highland Dr
- 117 S Highland Dr
- 4201 S Auburn St