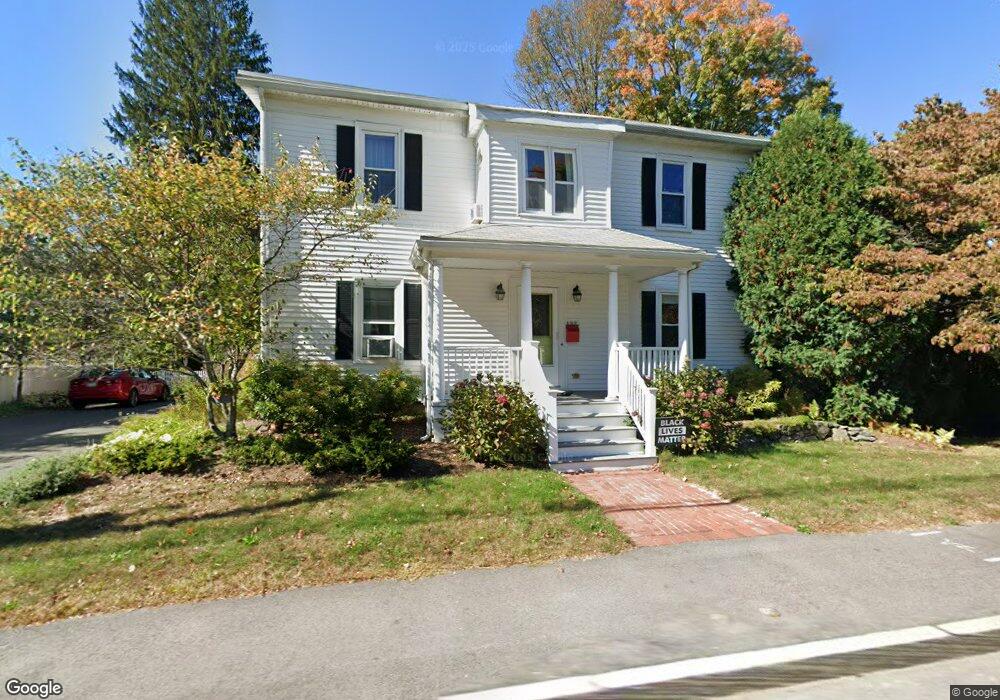
127 S Main St Natick, MA 01760
Estimated Value: $886,000 - $1,018,000
4
Beds
2
Baths
2,282
Sq Ft
$408/Sq Ft
Est. Value
About This Home
This home is located at 127 S Main St, Natick, MA 01760 and is currently estimated at $932,151, approximately $408 per square foot. 127 S Main St is a home located in Middlesex County with nearby schools including Natick High School, Johnson Elementary School, and J F Kennedy Middle School.
Ownership History
Date
Name
Owned For
Owner Type
Purchase Details
Closed on
May 2, 2024
Sold by
Craig Roger W and Picard-Craig Marie A
Bought by
Craig Ft and Craig
Current Estimated Value
Purchase Details
Closed on
Aug 31, 2000
Sold by
Fishman Lawrence and Valentine Wendy
Bought by
Craig Roger W and Craig Marie A
Purchase Details
Closed on
Jun 8, 1990
Sold by
Nigro Anthony J
Bought by
Fishman Lawrence
Purchase Details
Closed on
Sep 2, 1988
Sold by
Lanman Jonathan T
Bought by
Nigro Anthony J
Create a Home Valuation Report for This Property
The Home Valuation Report is an in-depth analysis detailing your home's value as well as a comparison with similar homes in the area
Home Values in the Area
Average Home Value in this Area
Purchase History
| Date | Buyer | Sale Price | Title Company |
|---|---|---|---|
| Craig Ft | -- | None Available | |
| Craig Ft | -- | None Available | |
| Craig Roger W | $317,250 | -- | |
| Fishman Lawrence | $188,000 | -- | |
| Fishman Lawrence | $188,000 | -- | |
| Nigro Anthony J | $205,000 | -- |
Source: Public Records
Mortgage History
| Date | Status | Borrower | Loan Amount |
|---|---|---|---|
| Previous Owner | Nigro Anthony J | $215,000 | |
| Previous Owner | Nigro Anthony J | $225,000 |
Source: Public Records
Tax History Compared to Growth
Tax History
| Year | Tax Paid | Tax Assessment Tax Assessment Total Assessment is a certain percentage of the fair market value that is determined by local assessors to be the total taxable value of land and additions on the property. | Land | Improvement |
|---|---|---|---|---|
| 2025 | $9,212 | $770,200 | $413,100 | $357,100 |
| 2024 | $8,881 | $724,400 | $390,200 | $334,200 |
| 2023 | $8,700 | $688,300 | $366,500 | $321,800 |
| 2022 | $8,379 | $628,100 | $333,800 | $294,300 |
| 2021 | $8,022 | $589,400 | $315,500 | $273,900 |
| 2020 | $7,647 | $561,900 | $288,000 | $273,900 |
| 2019 | $7,142 | $561,900 | $288,000 | $273,900 |
| 2018 | $6,834 | $523,700 | $274,300 | $249,400 |
| 2017 | $6,595 | $488,900 | $243,900 | $245,000 |
| 2016 | $6,419 | $473,000 | $230,400 | $242,600 |
| 2015 | $6,259 | $452,900 | $230,400 | $222,500 |
Source: Public Records
Map
Nearby Homes
- 6 Ambler Ct
- 47 High St
- 216-218 S Main St
- 20 Walcott St
- 8 Floral Avenue Extension
- 25 Forest Ave
- 8 Floral Ave Unit 8
- 8 Pitts St
- 16 West St
- 58 W Central St
- 48 S Main St Unit 7
- 15 Church St Unit 3
- 49 Summer St
- 11 Avon St
- 6B Lincoln St Unit 6B
- 4B Lincoln St Unit 4B
- 5 Wilson St Unit 5A
- 3 Wilson St Unit 3B
- 5 Deer Path
- 10 Sundance Way