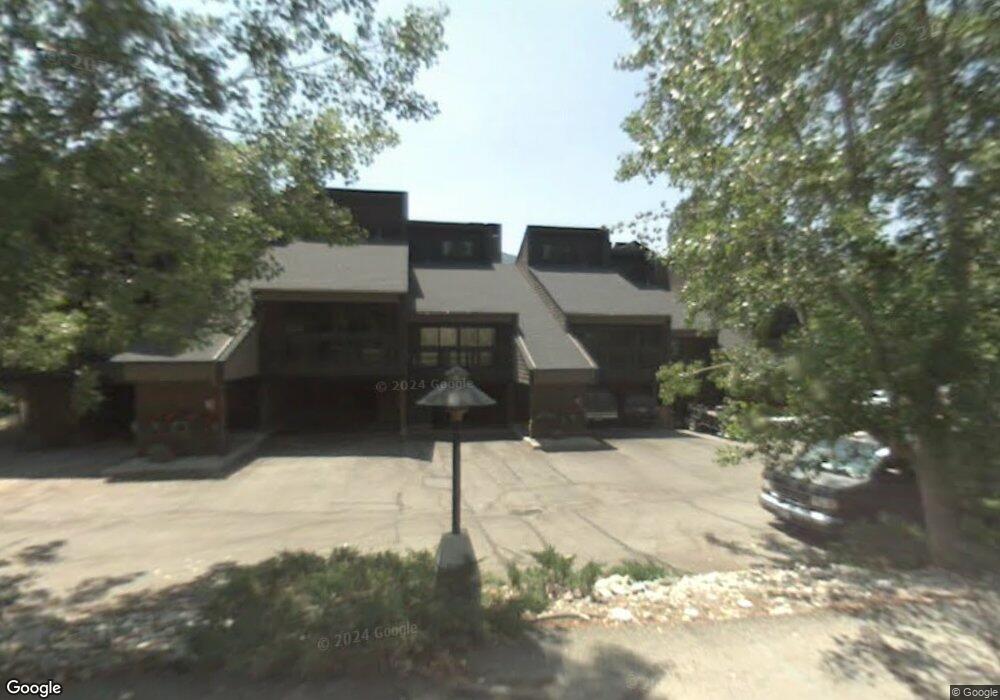
127 Saddle Rd Unit E9 Ketchum, ID 83340
Estimated Value: $1,004,000 - $1,401,567
2
Beds
2
Baths
1,313
Sq Ft
$895/Sq Ft
Est. Value
About This Home
This home is located at 127 Saddle Rd Unit E9, Ketchum, ID 83340 and is currently estimated at $1,175,392, approximately $895 per square foot. 127 Saddle Rd Unit E9 is a home located in Blaine County with nearby schools including Sun Valley Community School-Elementary, Sun Valley Community School-Upper, and Sun Valley Community School.
Ownership History
Date
Name
Owned For
Owner Type
Purchase Details
Closed on
Jun 25, 2024
Sold by
Mclaughlin William L
Bought by
Mclaughlin William L and Delong Elizabeth
Current Estimated Value
Purchase Details
Closed on
Jul 23, 2020
Sold by
Vancuren Wendy and Vancuren Van Curen
Bought by
Mclaughlin William and Delong Elizabeth
Home Financials for this Owner
Home Financials are based on the most recent Mortgage that was taken out on this home.
Original Mortgage
$481,500
Interest Rate
3.2%
Mortgage Type
New Conventional
Purchase Details
Closed on
Oct 23, 2018
Sold by
Hesse Richard J
Bought by
Vancuren Wendy Van and Vancuren Preston Van
Home Financials for this Owner
Home Financials are based on the most recent Mortgage that was taken out on this home.
Original Mortgage
$400,500
Interest Rate
4.5%
Mortgage Type
New Conventional
Create a Home Valuation Report for This Property
The Home Valuation Report is an in-depth analysis detailing your home's value as well as a comparison with similar homes in the area
Home Values in the Area
Average Home Value in this Area
Purchase History
| Date | Buyer | Sale Price | Title Company |
|---|---|---|---|
| Mclaughlin William L | -- | Title One | |
| Mclaughlin William | -- | Titleone Twin Falls | |
| Vancuren Wendy Van | -- | Blaine County Title |
Source: Public Records
Mortgage History
| Date | Status | Borrower | Loan Amount |
|---|---|---|---|
| Previous Owner | Mclaughlin William | $481,500 | |
| Previous Owner | Vancuren Wendy Van | $400,500 |
Source: Public Records
Tax History
| Year | Tax Paid | Tax Assessment Tax Assessment Total Assessment is a certain percentage of the fair market value that is determined by local assessors to be the total taxable value of land and additions on the property. | Land | Improvement |
|---|---|---|---|---|
| 2025 | $3,347 | $1,175,873 | $0 | $1,175,873 |
| 2024 | $3,347 | $1,175,873 | $0 | $1,175,873 |
| 2023 | $3,328 | $1,022,498 | $0 | $1,022,498 |
| 2022 | $2,867 | $730,356 | $0 | $730,356 |
| 2021 | $2,598 | $529,402 | $0 | $529,402 |
| 2020 | $2,023 | $346,145 | $0 | $346,145 |
| 2019 | $2,030 | $314,677 | $0 | $0 |
| 2018 | $2,019 | $299,692 | $0 | $0 |
| 2017 | $2,083 | $299,692 | $0 | $0 |
| 2016 | $2,120 | $302,886 | $0 | $0 |
| 2013 | -- | $264,039 | $0 | $0 |
Source: Public Records
Map
Nearby Homes
- 260 Spur Ln
- 115 Graduate Dr
- 120 Blue Grouse Ln
- 120 Galena Ct Unit B
- 200 E Canyon Run Blvd
- 691 N Walnut Ave N
- 1434 Cottonwood Condo Dr
- 106 River Run Dr
- 103 Snowbrush Ln
- 671 Alpine Ln N
- 420 Spruce Ave Unit A-H
- 360 9th St E Unit 12
- 531 E 6th St E
- 120 8th St W Unit 101
- 680 Sun Valley Rd E Unit D-4
- 680 Sun Valley Rd E Unit 12-F
- 680 Sun Valley Rd E
- 680 Sun Valley Rd E Unit 12-H
- 460 N Main St Unit 302 S
- 460 N Main St Unit 201 N
- 127 Saddle Rd Unit B16
- 127 Saddle Rd Unit D7
- 127 Saddle Rd Unit F2
- 127 Saddle Rd Unit F4
- 127 Saddle Rd Unit D4
- 127 Saddle Rd Unit B-14
- 127 Saddle Rd Unit E7
- 127 Saddle Rd Unit E6
- 125 Valleywood Dr
- 190 Valleywood Dr
- 154 Valleywood Dr
- 176 Valleywood Dr
- 115 Valleywood Dr
- 105 Valleywood Dr
- 123 Saddle Rd Unit A2
- 123 Saddle Rd
- 123 Saddle Rd Unit A6
- 118 Valleywood Dr
- 127 Saddle Road ( D-3 )
- 125 Valleywood Rd
Your Personal Tour Guide
Ask me questions while you tour the home.