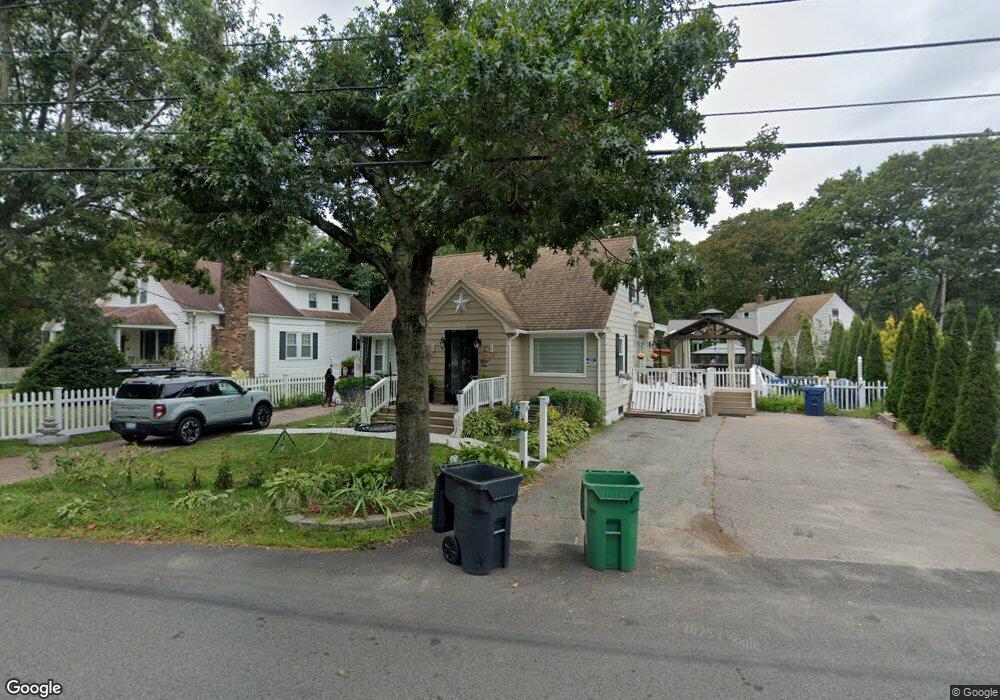
127 Sand Pond Rd Warwick, RI 02888
Spring Green NeighborhoodEstimated Value: $397,000 - $455,000
3
Beds
2
Baths
1,288
Sq Ft
$335/Sq Ft
Est. Value
About This Home
This home is located at 127 Sand Pond Rd, Warwick, RI 02888 and is currently estimated at $431,340, approximately $334 per square foot. 127 Sand Pond Rd is a home located in Kent County with nearby schools including Nel/Cps Construction Career and St. Peter School.
Ownership History
Date
Name
Owned For
Owner Type
Purchase Details
Closed on
Jul 29, 2013
Sold by
Choiniere Denise M
Bought by
Cintron Carlo M and Colon Sandra
Current Estimated Value
Home Financials for this Owner
Home Financials are based on the most recent Mortgage that was taken out on this home.
Original Mortgage
$147,283
Outstanding Balance
$105,933
Interest Rate
3.97%
Mortgage Type
New Conventional
Estimated Equity
$325,407
Purchase Details
Closed on
Jul 8, 1994
Sold by
Towne Donald G and Towne Claire
Bought by
Fricano Guy T and Choiniere Denise M
Create a Home Valuation Report for This Property
The Home Valuation Report is an in-depth analysis detailing your home's value as well as a comparison with similar homes in the area
Home Values in the Area
Average Home Value in this Area
Purchase History
| Date | Buyer | Sale Price | Title Company |
|---|---|---|---|
| Cintron Carlo M | $150,000 | -- | |
| Fricano Guy T | $105,000 | -- |
Source: Public Records
Mortgage History
| Date | Status | Borrower | Loan Amount |
|---|---|---|---|
| Open | Fricano Guy T | $147,283 | |
| Previous Owner | Fricano Guy T | $40,300 | |
| Previous Owner | Fricano Guy T | $20,000 |
Source: Public Records
Tax History
| Year | Tax Paid | Tax Assessment Tax Assessment Total Assessment is a certain percentage of the fair market value that is determined by local assessors to be the total taxable value of land and additions on the property. | Land | Improvement |
|---|---|---|---|---|
| 2025 | $4,976 | $391,800 | $124,900 | $266,900 |
| 2024 | $4,678 | $323,300 | $108,600 | $214,700 |
| 2023 | $4,588 | $323,300 | $108,600 | $214,700 |
| 2022 | $4,261 | $227,500 | $66,500 | $161,000 |
| 2021 | $4,261 | $227,500 | $66,500 | $161,000 |
| 2020 | $4,261 | $227,500 | $66,500 | $161,000 |
| 2019 | $4,261 | $227,500 | $66,500 | $161,000 |
| 2018 | $3,704 | $178,100 | $59,100 | $119,000 |
| 2017 | $3,605 | $178,100 | $59,100 | $119,000 |
| 2016 | $3,605 | $178,100 | $59,100 | $119,000 |
| 2015 | $3,276 | $157,900 | $56,900 | $101,000 |
| 2014 | $3,167 | $157,900 | $56,900 | $101,000 |
| 2013 | $3,125 | $157,900 | $56,900 | $101,000 |
Source: Public Records
Map
Nearby Homes
- 213 Easton Ave
- 1052 Post Rd
- 39 Holiday Ave
- 90 Massachusetts Ave
- 27 Frederick St
- 15 Christopher Rhodes Way
- 6 Christopher Rhodes Way
- 7 Michigan Ave
- 20 Commodore Ave
- 22 Phillips Ave
- 77 Kentucky Ave
- 35 Welfare Ave
- 821 Post Rd
- 63 Benbridge Ave
- 80 George St
- 0 Elmwood Ave
- 123 Harrington Ave
- 49 Patience Ct
- 1020 Warwick Ave
- 52 Recess Ln
Your Personal Tour Guide
Ask me questions while you tour the home.