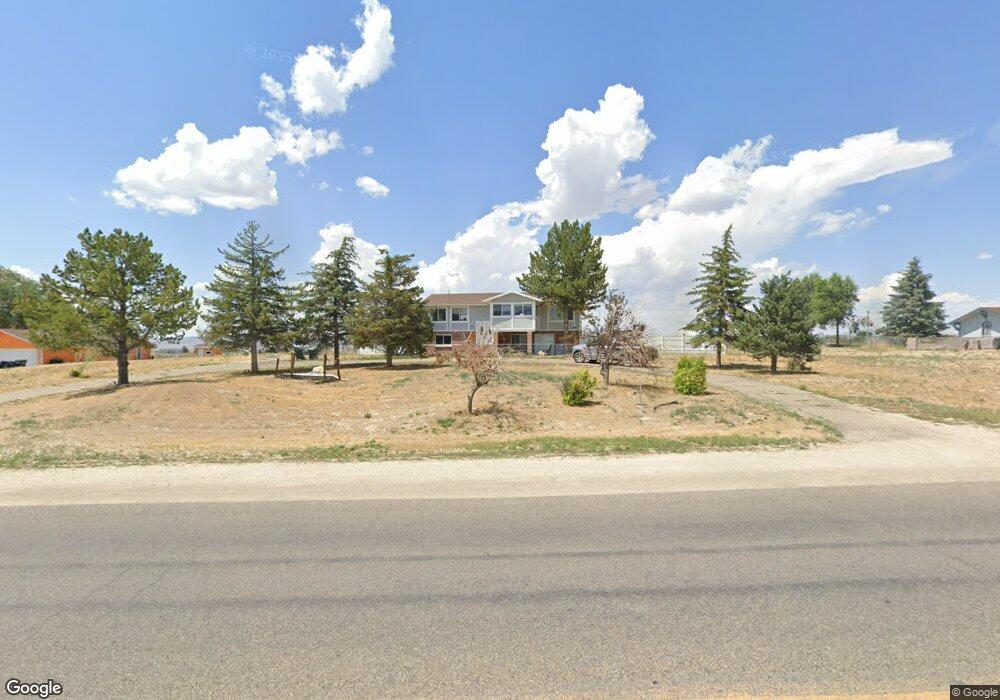
127 Spring Creek Pkwy Spring Creek, NV 89815
Estimated Value: $361,000 - $462,000
3
Beds
3
Baths
2,514
Sq Ft
$160/Sq Ft
Est. Value
About This Home
This home is located at 127 Spring Creek Pkwy, Spring Creek, NV 89815 and is currently estimated at $403,261, approximately $160 per square foot. 127 Spring Creek Pkwy is a home located in Elko County with nearby schools including Sage Elementary School, Spring Creek Middle School, and Spring Creek High School.
Ownership History
Date
Name
Owned For
Owner Type
Purchase Details
Closed on
Mar 6, 2020
Sold by
Coil Troy D and Coil Mary
Bought by
Day Dallas and Day Jasmine
Current Estimated Value
Home Financials for this Owner
Home Financials are based on the most recent Mortgage that was taken out on this home.
Original Mortgage
$240,562
Outstanding Balance
$212,646
Interest Rate
3.4%
Mortgage Type
FHA
Estimated Equity
$190,615
Purchase Details
Closed on
Jun 14, 2010
Sold by
Coil Troy D
Bought by
Coil Troy D and Coil Mary
Home Financials for this Owner
Home Financials are based on the most recent Mortgage that was taken out on this home.
Original Mortgage
$112,500
Interest Rate
4.99%
Mortgage Type
New Conventional
Purchase Details
Closed on
Jun 26, 2009
Sold by
Coil Troy D
Bought by
Coil Troy D
Create a Home Valuation Report for This Property
The Home Valuation Report is an in-depth analysis detailing your home's value as well as a comparison with similar homes in the area
Home Values in the Area
Average Home Value in this Area
Purchase History
| Date | Buyer | Sale Price | Title Company |
|---|---|---|---|
| Day Dallas | $245,000 | Wfg National Title Co Of Nv | |
| Coil Troy D | -- | Stewart Title Elko | |
| Coil Troy D | -- | None Available |
Source: Public Records
Mortgage History
| Date | Status | Borrower | Loan Amount |
|---|---|---|---|
| Open | Day Dallas | $240,562 | |
| Previous Owner | Coil Troy D | $112,500 |
Source: Public Records
Tax History Compared to Growth
Tax History
| Year | Tax Paid | Tax Assessment Tax Assessment Total Assessment is a certain percentage of the fair market value that is determined by local assessors to be the total taxable value of land and additions on the property. | Land | Improvement |
|---|---|---|---|---|
| 2025 | $1,744 | $62,820 | $14,000 | $48,820 |
| 2024 | $1,744 | $65,059 | $14,000 | $51,059 |
| 2023 | $1,494 | $58,230 | $9,975 | $48,255 |
| 2022 | $1,384 | $51,606 | $9,975 | $41,631 |
| 2021 | $1,557 | $54,461 | $9,975 | $44,486 |
| 2020 | $1,502 | $55,621 | $9,975 | $45,646 |
| 2019 | $1,458 | $51,601 | $7,700 | $43,901 |
| 2018 | $1,470 | $52,221 | $7,700 | $44,521 |
| 2017 | $1,342 | $52,249 | $7,700 | $44,549 |
| 2016 | $1,284 | $49,227 | $7,700 | $41,527 |
| 2015 | $1,261 | $49,275 | $7,700 | $41,575 |
| 2014 | $1,264 | $47,824 | $7,700 | $40,124 |
Source: Public Records
Map
Nearby Homes
- 150 Flora Ln
- 277 Glenvista Dr
- 236 Lakeport Dr
- 267 Northglen Dr
- 301 Lawndale Dr
- 379 Lakeport Dr
- 4 Licht Pkwy
- 426 Flora Dr
- 381 Oakshire Dr
- 411 Parkchester Dr
- 353 Parkchester Dr
- 334 Parkchester Dr
- 470 Lawndale Dr
- 363 Spring Creek Pkwy
- 243 Country Club Pkwy
- 260 Country Club Pkwy
- 131 Deerbrush Dr
- 488 Flora Plaza
- 241 Country Club Pkwy
- 277 Country Club Pkwy
- 133 Spring Creek Pkwy
- 121 Spring Creek Pkwy
- 115 Spring Creek Pkwy
- 130 Spring Creek Pkwy
- 122 Spring Creek Pkwy
- 118 Spring Creek Pkwy
- 107 Spring Creek Pkwy
- 138 Spring Creek Pkwy
- 251 Flora Dr
- 114 Spring Creek Pkwy
- 159 Flora Cir
- 247 Flora Dr
- 153 Flora Cir
- 101 Spring Creek Pkwy
- 119 Glen Brier Dr
- 271 Flora Dr
- 165 Flora Cir
- 154 Flora Cir
- 145 Spring Creek Pkwy
- 243 Flora Dr