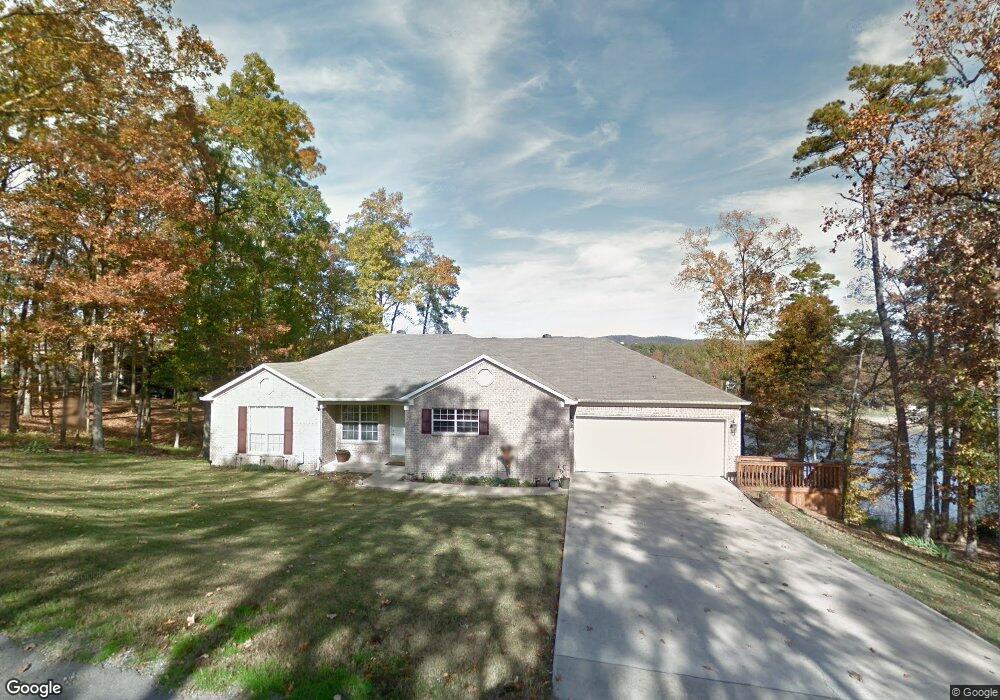
127 Spyglass Point Hot Springs National Park, AR 71913
Estimated Value: $222,000 - $401,000
--
Bed
2
Baths
1,540
Sq Ft
$199/Sq Ft
Est. Value
About This Home
This home is located at 127 Spyglass Point, Hot Springs National Park, AR 71913 and is currently estimated at $306,666, approximately $199 per square foot. 127 Spyglass Point is a home located in Hot Spring County with nearby schools including Magnet Cove Elementary School and Magnet Cove High School.
Ownership History
Date
Name
Owned For
Owner Type
Purchase Details
Closed on
Sep 25, 2009
Sold by
Mcdonald Gordon and Mcdonald Lorraine
Bought by
Colananni Richard M and Colananni Terri L
Current Estimated Value
Home Financials for this Owner
Home Financials are based on the most recent Mortgage that was taken out on this home.
Original Mortgage
$55,000
Interest Rate
5.16%
Mortgage Type
Future Advance Clause Open End Mortgage
Purchase Details
Closed on
Apr 21, 2006
Bought by
Mcdonald Sharon
Purchase Details
Closed on
Feb 21, 2003
Bought by
Mcdonald Gordon D and /Central Ar Foundation Homes L
Purchase Details
Closed on
Nov 6, 2002
Bought by
Central Ark Foundation Homes Llc
Purchase Details
Closed on
Oct 4, 2001
Bought by
Mcdonald Gordon and Mcdonald Lorraine
Purchase Details
Closed on
Mar 30, 1989
Bought by
Wright Joseph E and Virginia Lee
Create a Home Valuation Report for This Property
The Home Valuation Report is an in-depth analysis detailing your home's value as well as a comparison with similar homes in the area
Home Values in the Area
Average Home Value in this Area
Purchase History
| Date | Buyer | Sale Price | Title Company |
|---|---|---|---|
| Colananni Richard M | -- | Mcclure Title | |
| Mcdonald Sharon | -- | -- | |
| Mcdonald Gordon D | -- | -- | |
| Central Ark Foundation Homes Llc | -- | -- | |
| Mcdonald Gordon | $1,000 | -- | |
| Wright Joseph E | -- | -- |
Source: Public Records
Mortgage History
| Date | Status | Borrower | Loan Amount |
|---|---|---|---|
| Closed | Colananni Richard M | $55,000 |
Source: Public Records
Tax History Compared to Growth
Tax History
| Year | Tax Paid | Tax Assessment Tax Assessment Total Assessment is a certain percentage of the fair market value that is determined by local assessors to be the total taxable value of land and additions on the property. | Land | Improvement |
|---|---|---|---|---|
| 2025 | $1,275 | $49,540 | $14,000 | $35,540 |
| 2024 | $1,496 | $49,540 | $14,000 | $35,540 |
| 2023 | $1,450 | $49,540 | $14,000 | $35,540 |
| 2022 | $1,614 | $49,540 | $14,000 | $35,540 |
| 2021 | $1,607 | $49,540 | $14,000 | $35,540 |
| 2020 | $1,607 | $37,405 | $7,000 | $30,405 |
| 2019 | $1,607 | $37,405 | $7,000 | $30,405 |
| 2018 | $1,632 | $37,405 | $7,000 | $30,405 |
| 2017 | $1,526 | $37,405 | $7,000 | $30,405 |
| 2016 | $1,745 | $37,405 | $7,000 | $30,405 |
| 2015 | $1,335 | $36,115 | $6,825 | $29,290 |
| 2014 | $1,335 | $36,115 | $6,825 | $29,290 |
Source: Public Records
Map
Nearby Homes
- 206 & 208 Avonshire Terrace
- 208 Avonshire Terrace
- 206 Avonshire Terrace
- Lot 102 & 103 Marsh Harbor
- 110 Clifton Ct
- 109 Medinah Overlook
- Lot 1132A Edgehill Ct
- lot 1152A Edgehill Ct
- Lot 859 Morningside Dr
- 28 Edgemont Dr
- 28A Edgemont Dr
- Lots 552 & 553 Winterhaven Dr
- 249 Springbrook Dr
- 21 Springbrook Dr
- Lot 1612 Independence Dr
- Lot 825 Independence Dr
- 825 Independence Dr
- Lot 1092 Cedar Hill Dr
- 111 Oyster Bay Overlook
- 0 Winterhaven Dr Unit AV25-422
- 129 Spyglass Point
- 102 Kontiki Cir
- lot 143 Spyglass
- 140 Spyglass Rd
- 135 Spyglass Rd
- 142 Spyglass
- 104 Kontiki Cir
- 106 Kontiki Cir
- lot 140 & 141 Spyglass
- 139 Spyglass Point
- 000 Spyglass Point
- 109 Kontiki Cir
- 143 Spyglass Rd
- 0 Spyglass Rd Unit 22035123
- 0 Spyglass Rd
- lot 142 Spyglass Rd
- Lot 136 Spyglass Rd
- Lot 141 Spyglass Rd
- 0 Spyglass Rd Unit LOT 140
- 110 Kontiki Cir