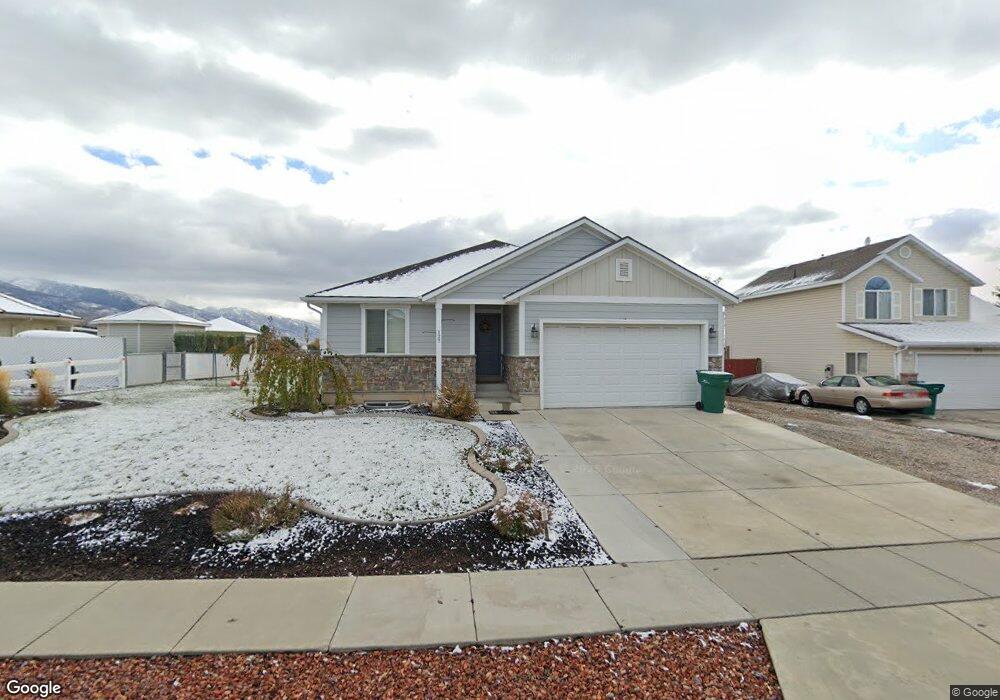
127 W 1525 N Layton, UT 84041
Estimated Value: $466,000 - $548,000
3
Beds
2
Baths
1,251
Sq Ft
$399/Sq Ft
Est. Value
About This Home
This home is located at 127 W 1525 N, Layton, UT 84041 and is currently estimated at $498,673, approximately $398 per square foot. 127 W 1525 N is a home with nearby schools including Lincoln Elementary School, North Layton Junior High School, and Northridge High School.
Ownership History
Date
Name
Owned For
Owner Type
Purchase Details
Closed on
Nov 4, 2013
Sold by
Purdy Bryan D
Bought by
Purdy Bryan G and Purdy Alysia
Current Estimated Value
Home Financials for this Owner
Home Financials are based on the most recent Mortgage that was taken out on this home.
Original Mortgage
$220,825
Outstanding Balance
$164,308
Interest Rate
4.25%
Mortgage Type
FHA
Estimated Equity
$334,365
Purchase Details
Closed on
Mar 15, 2013
Sold by
Mesa Development Inc
Bought by
Bulldog Sod Inc
Create a Home Valuation Report for This Property
The Home Valuation Report is an in-depth analysis detailing your home's value as well as a comparison with similar homes in the area
Home Values in the Area
Average Home Value in this Area
Purchase History
| Date | Buyer | Sale Price | Title Company |
|---|---|---|---|
| Purdy Bryan G | -- | Bonneville Superior Title C | |
| Purdy Bryan G | -- | None Available | |
| Bulldog Sod Inc | -- | Meridan Title Company |
Source: Public Records
Mortgage History
| Date | Status | Borrower | Loan Amount |
|---|---|---|---|
| Open | Purdy Bryan G | $220,825 |
Source: Public Records
Tax History Compared to Growth
Tax History
| Year | Tax Paid | Tax Assessment Tax Assessment Total Assessment is a certain percentage of the fair market value that is determined by local assessors to be the total taxable value of land and additions on the property. | Land | Improvement |
|---|---|---|---|---|
| 2025 | $2,379 | $249,700 | $99,118 | $150,582 |
| 2024 | $2,268 | $239,800 | $115,664 | $124,136 |
| 2023 | $2,275 | $424,000 | $139,109 | $284,891 |
| 2022 | $2,440 | $246,950 | $73,071 | $173,879 |
| 2021 | $2,259 | $341,000 | $101,243 | $239,757 |
| 2020 | $2,044 | $296,000 | $85,715 | $210,285 |
| 2019 | $2,016 | $286,000 | $81,892 | $204,108 |
| 2018 | $1,826 | $260,000 | $81,892 | $178,108 |
| 2016 | $1,733 | $127,270 | $25,821 | $101,449 |
| 2015 | $1,654 | $115,335 | $25,821 | $89,514 |
| 2014 | $1,717 | $122,422 | $25,821 | $96,601 |
| 2013 | -- | $50,760 | $50,760 | $0 |
Source: Public Records
Map
Nearby Homes