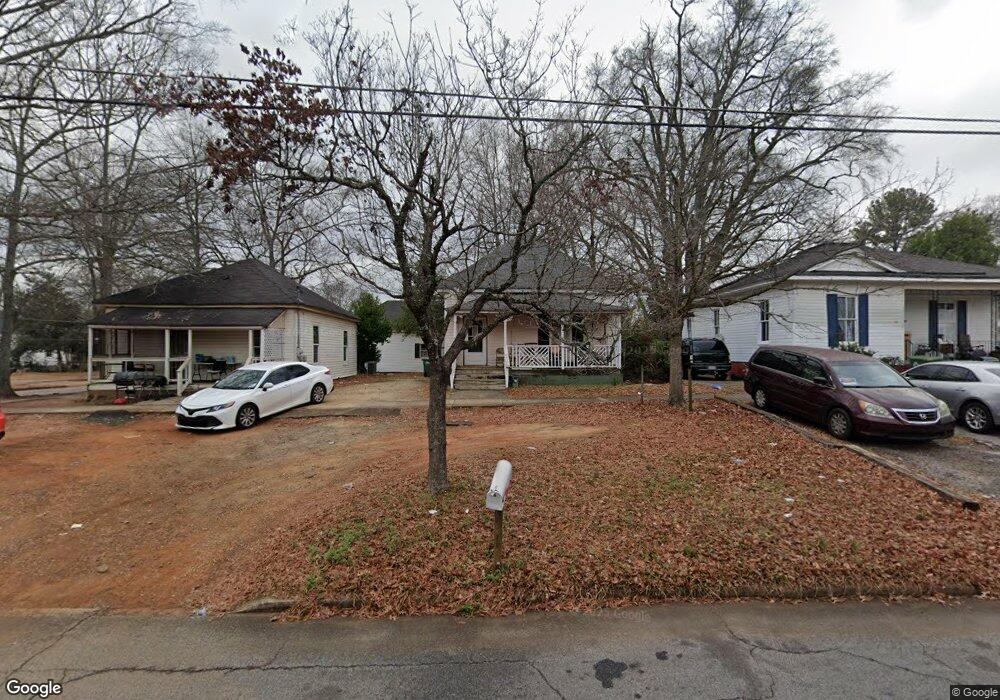
127 W Chappell St Griffin, GA 30223
Spalding County NeighborhoodEstimated Value: $88,190 - $160,000
2
Beds
2
Baths
888
Sq Ft
$130/Sq Ft
Est. Value
About This Home
This home is located at 127 W Chappell St, Griffin, GA 30223 and is currently estimated at $115,298, approximately $129 per square foot. 127 W Chappell St is a home located in Spalding County with nearby schools including Moore Elementary School, Kennedy Road Middle School, and Griffin High School.
Ownership History
Date
Name
Owned For
Owner Type
Purchase Details
Closed on
Jun 26, 1992
Sold by
Glover R H
Bought by
Willis James
Current Estimated Value
Purchase Details
Closed on
Nov 7, 1980
Sold by
Leach Herbert and Leach Geraldine
Bought by
Glover R H
Purchase Details
Closed on
Jan 9, 1978
Sold by
Moss Ophelia Christine
Bought by
Leach Herbert and Leach Geraldine
Purchase Details
Closed on
Apr 22, 1977
Sold by
Greason Louise and Moss Ophelia
Bought by
Moss Ophelia Christine
Purchase Details
Closed on
Jan 1, 1975
Sold by
Gunter Miss Gaudeth
Bought by
Gunter Sanford Etal
Purchase Details
Closed on
Jun 24, 1970
Sold by
Dunn Fred
Bought by
Gunter Miss Gaudeth
Purchase Details
Closed on
Sep 13, 1966
Sold by
Johnson W L G
Bought by
Dunn Fred
Purchase Details
Closed on
Feb 29, 1956
Bought by
Johnson W L G
Create a Home Valuation Report for This Property
The Home Valuation Report is an in-depth analysis detailing your home's value as well as a comparison with similar homes in the area
Home Values in the Area
Average Home Value in this Area
Purchase History
| Date | Buyer | Sale Price | Title Company |
|---|---|---|---|
| Willis James | $15,000 | -- | |
| Glover R H | -- | -- | |
| Leach Herbert | $12,000 | -- | |
| Moss Ophelia Christine | -- | -- | |
| Moss Ophelia Christine | $4,000 | -- | |
| Gunter Sanford Etal | -- | -- | |
| Gunter Miss Gaudeth | $6,000 | -- | |
| Dunn Fred | $3,300 | -- | |
| Johnson W L G | -- | -- |
Source: Public Records
Tax History Compared to Growth
Tax History
| Year | Tax Paid | Tax Assessment Tax Assessment Total Assessment is a certain percentage of the fair market value that is determined by local assessors to be the total taxable value of land and additions on the property. | Land | Improvement |
|---|---|---|---|---|
| 2024 | $831 | $21,755 | $3,400 | $18,355 |
| 2023 | $831 | $9,756 | $1,700 | $8,056 |
| 2022 | $341 | $8,540 | $1,100 | $7,440 |
| 2021 | $263 | $6,591 | $1,100 | $5,491 |
| 2020 | $263 | $6,591 | $1,100 | $5,491 |
| 2019 | $268 | $6,591 | $1,100 | $5,491 |
| 2018 | $266 | $6,306 | $1,100 | $5,206 |
| 2017 | $261 | $6,306 | $1,100 | $5,206 |
| 2016 | $265 | $6,306 | $1,100 | $5,206 |
| 2015 | $282 | $6,606 | $1,400 | $5,206 |
| 2014 | $291 | $6,606 | $1,400 | $5,206 |
Source: Public Records
Map
Nearby Homes
- 215 W Chappell St
- 218 W Central Ave
- 205 W Tinsley St
- 833 A&b E Tinsley St
- 418 N 9th St
- 325 W Quilly St
- 321 N 10th St
- 216 N 6th St
- 333 N 10th St
- 421 N 6th St
- 218 E Tinsley St
- 222 E Chappell St
- 411 Palace St
- 102 N Hill St Unit 304
- 102 N Hill St Unit 303
- 223 N 5th St
- 106 E Cherry St
- 102 E Cherry St
- 233 E Tinsley St
- 514 Lane St
- 133 W Chappell St
- 121 W Chappell St
- 306 N 8th St
- 312 N 8th St
- 119 W Chappell St
- 316 N 8th St
- 303 N 8th St
- 105 W Chappell St
- 126 W Chappell St
- 132 W Chappell St
- 204 W Chappell St
- 122 W Chappell St
- 315 N 8th St
- 118 W Chappell St
- 322 N 8th St
- 116 W Chappell St
- 111 W Quilly St
- 218 N 8th St
- 305 N Hill St
- 212 W Quilly St