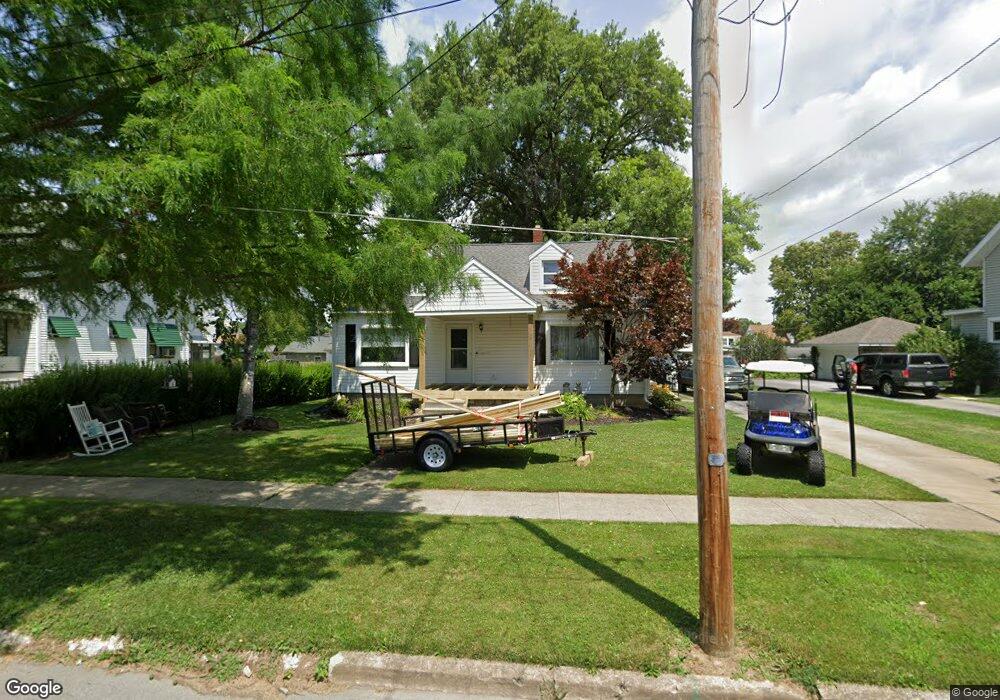
127 William Ave Bellevue, OH 44811
Estimated Value: $154,000 - $238,000
3
Beds
1
Bath
1,305
Sq Ft
$145/Sq Ft
Est. Value
About This Home
This home is located at 127 William Ave, Bellevue, OH 44811 and is currently estimated at $189,780, approximately $145 per square foot. 127 William Ave is a home located in Huron County with nearby schools including Bellevue Elementary School, Bellevue Middle School, and Bellevue High School.
Ownership History
Date
Name
Owned For
Owner Type
Purchase Details
Closed on
Sep 30, 2016
Sold by
Spears James L and Spears Myrna L
Bought by
Fields Wendell G and Fields Kimberly A
Current Estimated Value
Home Financials for this Owner
Home Financials are based on the most recent Mortgage that was taken out on this home.
Original Mortgage
$99,910
Outstanding Balance
$80,020
Interest Rate
3.43%
Mortgage Type
New Conventional
Estimated Equity
$109,760
Purchase Details
Closed on
Jun 9, 2008
Bought by
Spears James L and Spears Myrna L
Purchase Details
Closed on
Feb 14, 2002
Sold by
Doster Daniel H
Bought by
Bollinger John M
Home Financials for this Owner
Home Financials are based on the most recent Mortgage that was taken out on this home.
Original Mortgage
$90,250
Interest Rate
7.23%
Mortgage Type
Purchase Money Mortgage
Purchase Details
Closed on
Mar 19, 1998
Bought by
Doster Daniel H
Purchase Details
Closed on
Apr 15, 1991
Bought by
Doster David A
Create a Home Valuation Report for This Property
The Home Valuation Report is an in-depth analysis detailing your home's value as well as a comparison with similar homes in the area
Home Values in the Area
Average Home Value in this Area
Purchase History
| Date | Buyer | Sale Price | Title Company |
|---|---|---|---|
| Fields Wendell G | $103,000 | Attorney | |
| Spears James L | $97,000 | -- | |
| Bollinger John M | $95,000 | -- | |
| Doster Daniel H | -- | -- | |
| Doster David A | -- | -- |
Source: Public Records
Mortgage History
| Date | Status | Borrower | Loan Amount |
|---|---|---|---|
| Open | Fields Wendell G | $99,910 | |
| Closed | Bollinger John M | $90,250 |
Source: Public Records
Tax History Compared to Growth
Tax History
| Year | Tax Paid | Tax Assessment Tax Assessment Total Assessment is a certain percentage of the fair market value that is determined by local assessors to be the total taxable value of land and additions on the property. | Land | Improvement |
|---|---|---|---|---|
| 2024 | $2,454 | $60,340 | $9,680 | $50,660 |
| 2023 | $2,454 | $42,840 | $6,370 | $36,470 |
| 2022 | $1,847 | $42,840 | $6,370 | $36,470 |
| 2021 | $1,862 | $42,840 | $6,370 | $36,470 |
| 2020 | $1,736 | $37,750 | $6,370 | $31,380 |
| 2019 | $1,712 | $37,750 | $6,370 | $31,380 |
| 2018 | $1,689 | $37,750 | $6,370 | $31,380 |
| 2017 | $1,361 | $31,210 | $6,130 | $25,080 |
| 2016 | $1,056 | $24,830 | $6,130 | $18,700 |
| 2015 | $1,080 | $24,840 | $6,130 | $18,710 |
| 2014 | $1,216 | $27,130 | $6,130 | $21,000 |
| 2013 | $1,179 | $26,600 | $5,600 | $21,000 |
Source: Public Records
Map
Nearby Homes
- 819 Castalia St
- 808 Castalia St
- 124 Sunset Dr
- 303 Moore Ave
- 130 Huffman St
- 219 Huffman St
- 126 Greenwood Heights
- 408 W Main St
- 140 Harkness St
- 206 Southwest St
- 129 Hamilton St
- 501 E Center St
- 118 Maplewood
- 231 Lawrence St
- 154 Ashford Ave
- 817 E Main St
- 0 Oakwood Dr
- 230 Highland Ave Unit 106
- 150 Redwood Dr
- 155 Ashford Ave
- 123 William Ave
- 135 William Ave
- 141 William Ave
- 141 Williams Ave
- 134 Aigler Blvd
- 128 Aigler Blvd
- 122 Aigler Blvd
- 136 Aigler Blvd
- 810 Northwest St
- 126 William Ave
- 130 William Ave
- 122 William Ave
- 140 Aigler Blvd
- 134 William Ave
- 147 William Ave
- 138 William Ave
- 716 Northwest St
- 826 Northwest St
- 142 William Ave
- 814 Northwest St