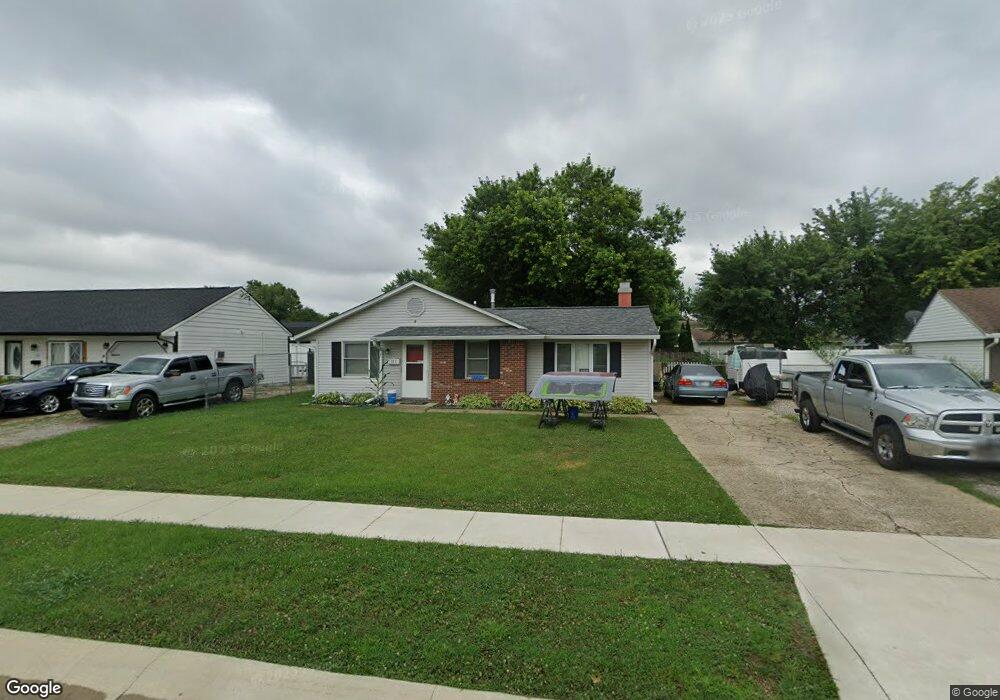
127 Windemere Rd Unit 195 Whiteland, IN 46184
Estimated Value: $208,000 - $234,000
3
Beds
1
Bath
1,094
Sq Ft
$201/Sq Ft
Est. Value
About This Home
This home is located at 127 Windemere Rd Unit 195, Whiteland, IN 46184 and is currently estimated at $219,458, approximately $200 per square foot. 127 Windemere Rd Unit 195 is a home located in Johnson County with nearby schools including Break-O-Day Elementary School, Clark-Pleasant Middle School, and Whiteland Community High School.
Ownership History
Date
Name
Owned For
Owner Type
Purchase Details
Closed on
May 12, 2017
Sold by
Sequoia Financial Services Llc
Bought by
Runk Greg and Runk Cara E
Current Estimated Value
Home Financials for this Owner
Home Financials are based on the most recent Mortgage that was taken out on this home.
Original Mortgage
$67,500
Outstanding Balance
$35,110
Interest Rate
4.08%
Mortgage Type
New Conventional
Estimated Equity
$184,348
Purchase Details
Closed on
Nov 10, 2016
Sold by
Secretary Housing Urban Development
Bought by
Sequoia Financial Services Llc
Purchase Details
Closed on
Jun 28, 2016
Sold by
Pnc Bank Na
Bought by
Housing Urban Development
Purchase Details
Closed on
May 19, 2016
Sold by
Pnc Bank National Association and Cook Larry Lee
Bought by
Pnc Bank National Association
Purchase Details
Closed on
May 12, 2011
Sold by
Cook Larry Lee and Cook Bobby Ray
Bought by
Cook Bobby Ray and Cook Larry Lee
Create a Home Valuation Report for This Property
The Home Valuation Report is an in-depth analysis detailing your home's value as well as a comparison with similar homes in the area
Home Values in the Area
Average Home Value in this Area
Purchase History
| Date | Buyer | Sale Price | Title Company |
|---|---|---|---|
| Runk Greg | -- | None Available | |
| Sequoia Financial Services Llc | -- | None Available | |
| Housing Urban Development | -- | None Available | |
| Pnc Bank National Association | $60,660 | None Available | |
| Cook Bobby Ray | -- | None Available |
Source: Public Records
Mortgage History
| Date | Status | Borrower | Loan Amount |
|---|---|---|---|
| Open | Runk Greg | $67,500 |
Source: Public Records
Tax History Compared to Growth
Tax History
| Year | Tax Paid | Tax Assessment Tax Assessment Total Assessment is a certain percentage of the fair market value that is determined by local assessors to be the total taxable value of land and additions on the property. | Land | Improvement |
|---|---|---|---|---|
| 2025 | $3,438 | $173,000 | $42,000 | $131,000 |
| 2024 | $3,438 | $164,600 | $42,000 | $122,600 |
| 2023 | $3,292 | $157,800 | $42,000 | $115,800 |
| 2022 | $3,211 | $154,500 | $35,000 | $119,500 |
| 2021 | $2,848 | $136,400 | $35,000 | $101,400 |
| 2020 | $2,132 | $101,400 | $23,500 | $77,900 |
| 2019 | $1,985 | $94,400 | $17,900 | $76,500 |
| 2018 | $1,921 | $93,000 | $15,100 | $77,900 |
| 2017 | $1,896 | $94,100 | $15,100 | $79,000 |
| 2016 | $1,655 | $85,300 | $15,100 | $70,200 |
| 2014 | $1,590 | $77,800 | $15,300 | $62,500 |
| 2013 | $1,590 | $79,400 | $15,300 | $64,100 |
Source: Public Records
Map
Nearby Homes
- 190 Tracy Ridge Blvd
- 256 Bittersweet Dr
- 106 Tracy Ridge Blvd
- 1119 Chateaugay Ct
- 57 Oakden Ct
- 53 Oakden Ct
- 6540 N Us Highway 31
- 1041 Mount Olive Rd
- 638 Harvest Meadow Way
- 821 Princeton Dr
- 559 Genisis Dr
- 250 Southlane Dr
- 840 Sweetbriar Ave
- 50 Meadow Creek Blvd
- 111 Meadow Creek Blvd
- 12 Rypma Row
- 0 E 700 N Unit MBR22036500
- 624 Sweetbriar Ave
- 539 Delbrook Dr
- 239 Shelton Place
- 127 Windemere Rd
- 129 Windemere Rd
- 125 Windemere Rd
- 128 Brentwood Ln
- 130 Brentwood Ln
- 131 Windemere Rd
- 123 Windemere Rd
- 126 Windemere Rd Unit RE
- 128 Windemere Rd
- 132 Brentwood Ln
- 124 Brentwood Ln
- 126 Brentwood Ln
- 130 Windemere Rd
- 133 Windemere Rd
- 120 Brentwood Ln
- 121 Windemere Rd
- 120 Windemere Rd
- 134 Brentwood Ln
- 134 Windemere Rd
- 135 Windemere Rd