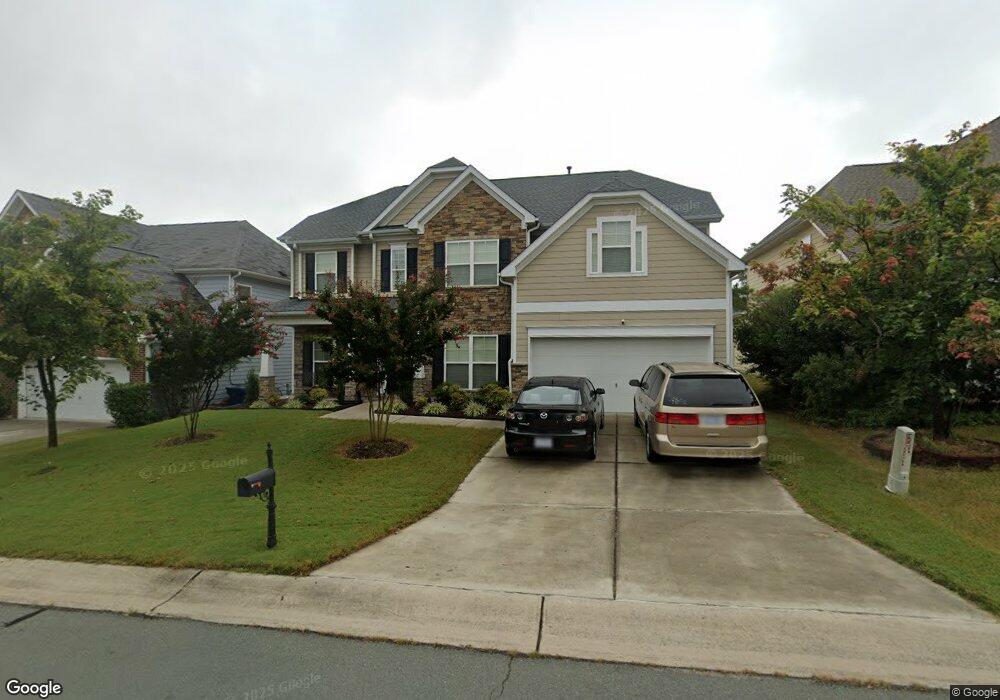
127 Windrush Ln Durham, NC 27703
Eastern Durham NeighborhoodEstimated Value: $470,512 - $610,000
5
Beds
3
Baths
2,700
Sq Ft
$202/Sq Ft
Est. Value
About This Home
This home is located at 127 Windrush Ln, Durham, NC 27703 and is currently estimated at $545,378, approximately $201 per square foot. 127 Windrush Ln is a home located in Durham County with nearby schools including Spring Valley Elementary School, John W Neal Middle School, and Southern School of Energy & Sustainability.
Ownership History
Date
Name
Owned For
Owner Type
Purchase Details
Closed on
Feb 29, 2016
Sold by
Brown Nykedtra Martin
Bought by
Kirsch Robert J and Kirsch Michelle Lynn
Current Estimated Value
Home Financials for this Owner
Home Financials are based on the most recent Mortgage that was taken out on this home.
Original Mortgage
$210,000
Outstanding Balance
$166,600
Interest Rate
3.72%
Estimated Equity
$378,778
Purchase Details
Closed on
Sep 6, 2012
Sold by
Strickland Jesse F and Strickland Sharon L
Bought by
Brown Nykedtra Martin and Brown Demario
Home Financials for this Owner
Home Financials are based on the most recent Mortgage that was taken out on this home.
Original Mortgage
$216,505
Interest Rate
3.63%
Mortgage Type
New Conventional
Purchase Details
Closed on
Nov 30, 2010
Sold by
Hearthstone Multi Asset Entity B L P
Bought by
Strickland Jesse F and Strickland Sharon L
Home Financials for this Owner
Home Financials are based on the most recent Mortgage that was taken out on this home.
Original Mortgage
$222,644
Interest Rate
4.4%
Mortgage Type
FHA
Create a Home Valuation Report for This Property
The Home Valuation Report is an in-depth analysis detailing your home's value as well as a comparison with similar homes in the area
Home Values in the Area
Average Home Value in this Area
Purchase History
| Date | Buyer | Sale Price | Title Company |
|---|---|---|---|
| Kirsch Robert J | $270,000 | -- | |
| Brown Nykedtra Martin | $228,000 | None Available | |
| Strickland Jesse F | $234,000 | None Available |
Source: Public Records
Mortgage History
| Date | Status | Borrower | Loan Amount |
|---|---|---|---|
| Open | Kirsch Robert J | $210,000 | |
| Previous Owner | Brown Nykedtra Martin | $216,505 | |
| Previous Owner | Strickland Jesse F | $222,644 |
Source: Public Records
Tax History
| Year | Tax Paid | Tax Assessment Tax Assessment Total Assessment is a certain percentage of the fair market value that is determined by local assessors to be the total taxable value of land and additions on the property. | Land | Improvement |
|---|---|---|---|---|
| 2025 | $4,583 | $462,285 | $100,300 | $361,985 |
| 2024 | $3,982 | $285,489 | $44,175 | $241,314 |
| 2023 | $3,740 | $285,489 | $44,175 | $241,314 |
| 2022 | $3,654 | $285,489 | $44,175 | $241,314 |
| 2021 | $3,637 | $285,489 | $44,175 | $241,314 |
| 2020 | $3,551 | $285,489 | $44,175 | $241,314 |
| 2019 | $3,551 | $285,489 | $44,175 | $241,314 |
| 2018 | $3,671 | $270,607 | $47,120 | $223,487 |
| 2017 | $3,644 | $270,607 | $47,120 | $223,487 |
| 2016 | $3,521 | $270,607 | $47,120 | $223,487 |
| 2015 | $3,539 | $255,650 | $44,947 | $210,703 |
| 2014 | $3,539 | $255,650 | $44,947 | $210,703 |
Source: Public Records
Map
Nearby Homes
- 106 Token House Rd
- 148 Daneborg Rd
- 140 Token House Rd
- 142 Token House Rd
- 500 Kings Lake Way
- 111 Glenview Ln
- 1107 High Fox Dr
- 3311 Delmar Dr
- 1821 S Mineral Springs Rd
- 1118 Constellation Cir
- 1122 Constellation Cir
- 1116 Constellation Cir
- 3311 Gypsum Dr
- 3301 Gypsum Dr
- 1020 Constellation Cir
- 1029 Constellation Cir
- 1031 Constellation Cir
- 1033 Constellation Cir
- 3210 Gypsum Dr
- 3212 Gypsum Dr
- 129 Windrush Ln
- 1718 Willowcrest Rd
- 123 Windrush Ln
- 119 Windrush Ln
- 1716 Willowcrest Rd
- 128 Windrush Ln
- 131 Windrush Ln
- 126 Windrush Ln
- 130 Windrush Ln
- 133 Windrush Ln
- 124 Windrush Ln
- 134 Windrush Ln
- 1714 Willowcrest Rd
- 122 Windrush Ln
- 115 Windrush Ln
- 120 Windrush Ln
- 1715 Willowcrest Rd
- 241 Ashton Glen
- 243 Ashton Glen
- 136 Windrush Ln
Your Personal Tour Guide
Ask me questions while you tour the home.