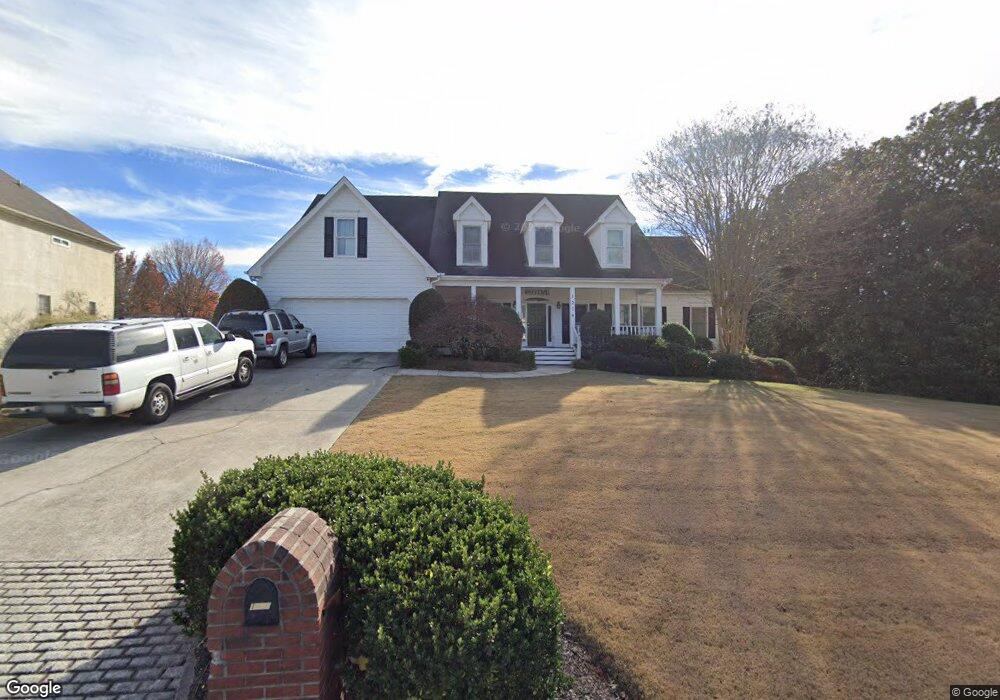
1270 Castle Pointe Ln Unit 1 Grayson, GA 30017
Estimated Value: $496,954 - $545,000
4
Beds
4
Baths
2,339
Sq Ft
$226/Sq Ft
Est. Value
About This Home
This home is located at 1270 Castle Pointe Ln Unit 1, Grayson, GA 30017 and is currently estimated at $527,989, approximately $225 per square foot. 1270 Castle Pointe Ln Unit 1 is a home located in Gwinnett County with nearby schools including Pharr Elementary School, Couch Middle School, and Grayson High School.
Ownership History
Date
Name
Owned For
Owner Type
Purchase Details
Closed on
Feb 17, 2011
Sold by
Federal Home Loan Mortgage Corporation
Bought by
Mcfadden Aubrey C and Mcfadden Christina H
Current Estimated Value
Home Financials for this Owner
Home Financials are based on the most recent Mortgage that was taken out on this home.
Original Mortgage
$206,962
Outstanding Balance
$140,141
Interest Rate
4.87%
Mortgage Type
FHA
Estimated Equity
$387,848
Purchase Details
Closed on
Dec 1, 2009
Sold by
Flagstar Bk Fsb
Bought by
Federal Home Loan Mortgage Corporation
Purchase Details
Closed on
Feb 7, 2003
Sold by
Townsend James T and Townsend Kim A
Bought by
Silvey Brenda F
Home Financials for this Owner
Home Financials are based on the most recent Mortgage that was taken out on this home.
Original Mortgage
$210,600
Interest Rate
5.89%
Mortgage Type
New Conventional
Create a Home Valuation Report for This Property
The Home Valuation Report is an in-depth analysis detailing your home's value as well as a comparison with similar homes in the area
Home Values in the Area
Average Home Value in this Area
Purchase History
| Date | Buyer | Sale Price | Title Company |
|---|---|---|---|
| Mcfadden Aubrey C | $185,000 | -- | |
| Federal Home Loan Mortgage Corporation | -- | -- | |
| Flagstar Bk Fsb | -- | -- | |
| Silvey Brenda F | $263,300 | -- |
Source: Public Records
Mortgage History
| Date | Status | Borrower | Loan Amount |
|---|---|---|---|
| Open | Mcfadden Aubrey C | $206,962 | |
| Previous Owner | Silvey Brenda F | $210,600 |
Source: Public Records
Tax History
| Year | Tax Paid | Tax Assessment Tax Assessment Total Assessment is a certain percentage of the fair market value that is determined by local assessors to be the total taxable value of land and additions on the property. | Land | Improvement |
|---|---|---|---|---|
| 2025 | $6,372 | $204,640 | $36,000 | $168,640 |
| 2024 | $6,449 | $199,040 | $36,000 | $163,040 |
| 2023 | $6,449 | $191,320 | $40,000 | $151,320 |
| 2022 | $5,931 | $176,120 | $34,800 | $141,320 |
| 2021 | $5,491 | $140,640 | $30,000 | $110,640 |
| 2020 | $5,187 | $131,360 | $25,600 | $105,760 |
| 2019 | $4,994 | $131,360 | $25,600 | $105,760 |
| 2018 | $4,120 | $106,200 | $24,000 | $82,200 |
| 2016 | $3,731 | $94,640 | $18,000 | $76,640 |
| 2015 | $3,770 | $94,640 | $18,000 | $76,640 |
| 2014 | -- | $88,160 | $18,000 | $70,160 |
Source: Public Records
Map
Nearby Homes
- 1306 Annapolis Way
- 1729 Pinehurst View Ct
- 1404 Hattiesburg Ct
- 986 Lakeview Oaks Ct Unit 26-B
- 986 Lakeview Oaks Ct
- 1210 Hogan Ridge Dr
- 1860 Pinehurst View Dr
- 1429 Lakeview Rd
- 1430 Roanoke Trace
- 1476 Annapolis Way
- 1405 Wilmington Way Unit 4
- 1520 Natchez Way
- 621 Pineberry Ct
- 1470 Highland Lake Dr
- 1455 Timberlane Rd
- 1337 Cotton Creek Dr
- 1337 Cotton Creek Dr Unit 1
- 1327 Cotton Creek Dr
- 1603 Glenwood Way Unit 1
- 1955 Lakewood Trace
- 1260 Castle Pointe Ln
- 0 Castle Point Unit LOT 14 3012525
- 0 Castle Point Unit LOT 11 3012524
- 0 Castle Point Unit LOT 10 3012523
- 0 Castle Point Unit LOT 9 3012522
- 1289 Carlisle Ct Unit 2
- 1269 Carlisle Ct Unit 2
- 1250 Castle Pointe Ln
- 1689 Harrogate Ct
- 1275 Castle Pointe Ln
- 1265 Castle Pointe Ln
- 1256 Annapolis Way
- 1259 Carlisle Ct Unit 2
- 1284 Carlisle Ct
- 1317 Hillside Dr
- 1266 Annapolis Way
- 1246 Annapolis Way Unit 5
- 1245 Castle Pointe Ln Unit 4
- 1245 Castle Pointe Ln Unit 1
- 1274 Carlisle Ct Unit 2
Your Personal Tour Guide
Ask me questions while you tour the home.