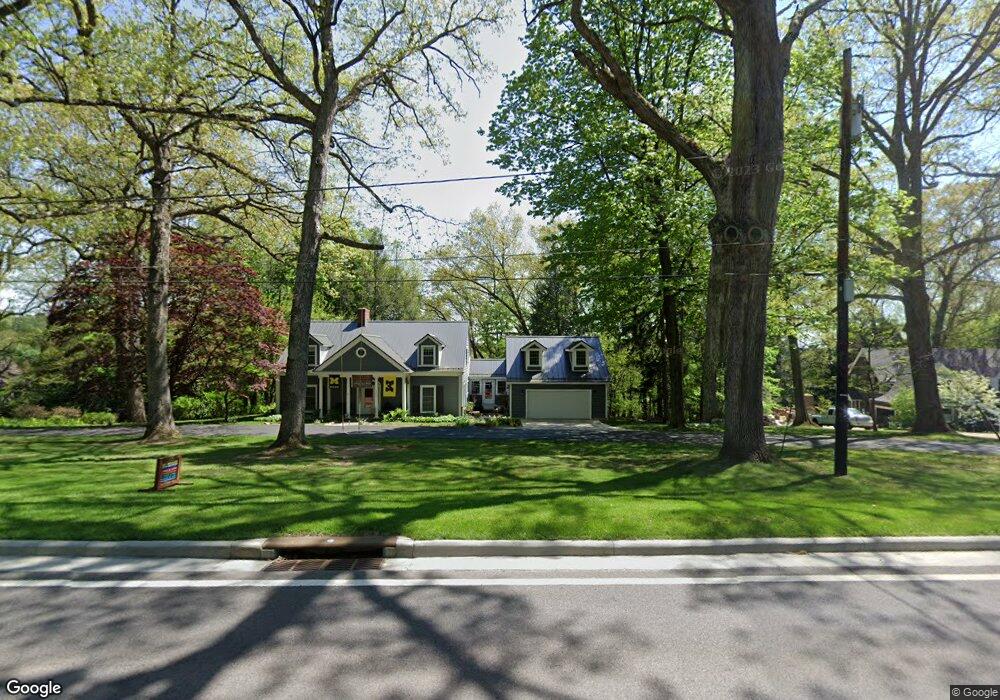
1270 Gambier Rd Mount Vernon, OH 43050
Estimated Value: $377,000 - $653,000
3
Beds
3
Baths
2,622
Sq Ft
$183/Sq Ft
Est. Value
About This Home
This home is located at 1270 Gambier Rd, Mount Vernon, OH 43050 and is currently estimated at $479,151, approximately $182 per square foot. 1270 Gambier Rd is a home located in Knox County with nearby schools including Mount Vernon High School, St. Vincent de Paul School, and Christian Star Academy.
Ownership History
Date
Name
Owned For
Owner Type
Purchase Details
Closed on
Sep 14, 2017
Sold by
Ellsworth Christopher C and Ellsworth Anne H
Bought by
Ellsworth Christopher C and Ellsworth Anne H
Current Estimated Value
Purchase Details
Closed on
Apr 16, 2011
Sold by
Williams Joshua R and Williams Julianne I
Bought by
Ellsworth Christopher C and Ellsworth Anne H
Purchase Details
Closed on
Nov 26, 2007
Sold by
Vela Carlos J and Vela Christine M
Bought by
Williams Joshua R and Williams Julianne I
Home Financials for this Owner
Home Financials are based on the most recent Mortgage that was taken out on this home.
Original Mortgage
$169,000
Interest Rate
6.31%
Mortgage Type
New Conventional
Purchase Details
Closed on
Mar 30, 1990
Bought by
Vela Carlos J and Vela Christine
Purchase Details
Closed on
Oct 9, 1987
Sold by
Costello Madeleine S
Bought by
Chicago Title Ins As No
Create a Home Valuation Report for This Property
The Home Valuation Report is an in-depth analysis detailing your home's value as well as a comparison with similar homes in the area
Home Values in the Area
Average Home Value in this Area
Purchase History
| Date | Buyer | Sale Price | Title Company |
|---|---|---|---|
| Ellsworth Christopher C | -- | None Available | |
| Ellsworth Christopher C | $117,000 | Chicago Title | |
| Williams Joshua R | $171,750 | None Available | |
| Vela Carlos J | $126,000 | -- | |
| Chicago Title Ins As No | $115,000 | -- |
Source: Public Records
Mortgage History
| Date | Status | Borrower | Loan Amount |
|---|---|---|---|
| Previous Owner | Williams Joshua R | $169,000 |
Source: Public Records
Tax History Compared to Growth
Tax History
| Year | Tax Paid | Tax Assessment Tax Assessment Total Assessment is a certain percentage of the fair market value that is determined by local assessors to be the total taxable value of land and additions on the property. | Land | Improvement |
|---|---|---|---|---|
| 2024 | $5,500 | $142,610 | $19,850 | $122,760 |
| 2023 | $5,500 | $142,610 | $19,850 | $122,760 |
| 2022 | $4,644 | $109,700 | $15,270 | $94,430 |
| 2021 | $4,644 | $109,700 | $15,270 | $94,430 |
| 2020 | $4,523 | $109,700 | $15,270 | $94,430 |
| 2019 | $3,359 | $75,900 | $16,170 | $59,730 |
| 2018 | $2,957 | $75,900 | $16,170 | $59,730 |
| 2017 | $2,904 | $66,790 | $16,170 | $50,620 |
| 2016 | $2,694 | $61,840 | $14,970 | $46,870 |
| 2015 | $2,706 | $61,840 | $14,970 | $46,870 |
| 2014 | $2,719 | $61,840 | $14,970 | $46,870 |
| 2013 | $3,117 | $67,620 | $14,590 | $53,030 |
Source: Public Records
Map
Nearby Homes
- 4 Craig Dr
- 1109 Oak Street Extension
- 1107 Oak Street Extension
- 301 Teryl Dr
- 2 Coventry Ct
- 2 Coventry Ct W
- 60 Wildwood Ln
- 900 E Gambier St
- 1575 New Gambier Rd
- 501 Oak St
- 200 Eastwood Dr
- 55 Wildwood Ln
- 812 Howard St
- 800 E Vine St
- 0 Wildwood Ln
- 42 Wildwood Ln
- 105 N Center St
- 114 Ringold St
- 613 E Gambier St
- 1280 Gambier Rd
- 17520 Gambier Rd
- 1260 Gambier Rd
- 1290 Gambier Rd
- 1261 Gambier Rd
- 1250 Gambier Rd
- 1281 Gambier Rd
- 1205 Park Rd
- 2.911 Acres Gambier Rd
- Lot 2 Gambier Rd
- Lot 1 Gambier Rd
- 0 Gambier Rd
- 1241 Gambier Rd
- 1291 Gambier Rd
- 1250 New Gambier Rd
- 1221 Gambier Rd
- 1340 Gambier Rd
- 1275 Park Rd
- 1295 Gambier Rd
- 17100 Park Rd