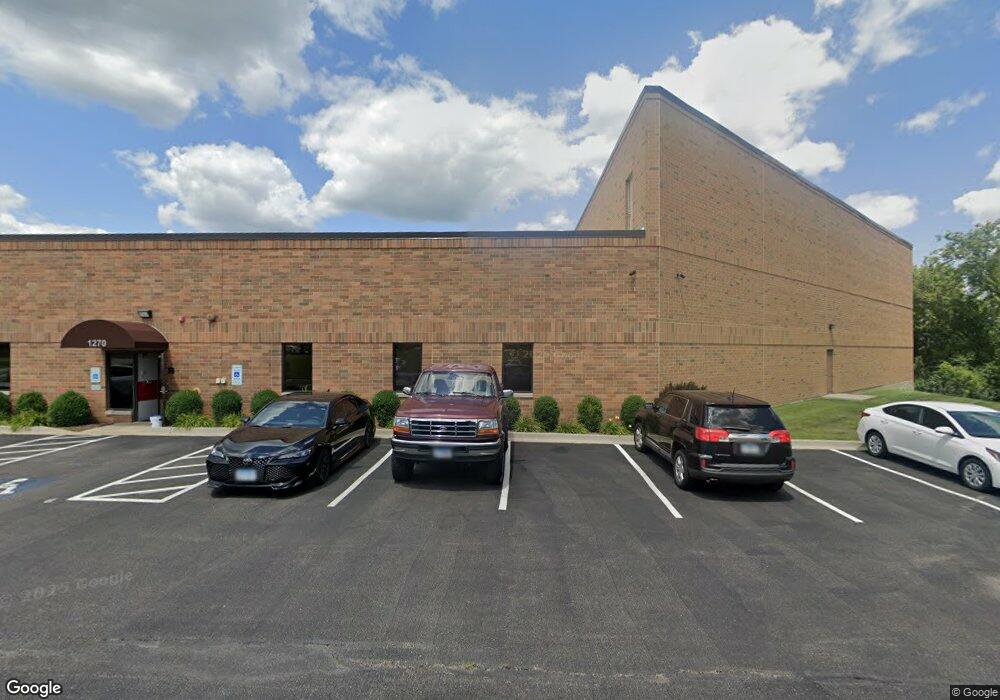
1270 Kyle Ct Wauconda, IL 60084
Estimated Value: $1,225,189
--
Bed
--
Bath
9,935
Sq Ft
$123/Sq Ft
Est. Value
About This Home
This home is located at 1270 Kyle Ct, Wauconda, IL 60084 and is currently estimated at $1,225,189, approximately $123 per square foot. 1270 Kyle Ct is a home located in Lake County with nearby schools including Robert Crown School, Wauconda Middle School, and Wauconda High School.
Ownership History
Date
Name
Owned For
Owner Type
Purchase Details
Closed on
Oct 14, 2016
Sold by
Pratt Richard W and Pratt Marie L
Bought by
Chicago Title Land Trust Company and Trust #5082-Ah
Current Estimated Value
Purchase Details
Closed on
Apr 15, 2016
Sold by
Mack Realty Associates Of Illinois Llc
Bought by
Pratt Richard W and Pratt Marie L
Purchase Details
Closed on
Apr 29, 2005
Sold by
Oak Brook Bank
Bought by
Mack Realty Associates Of Illinois Llc
Home Financials for this Owner
Home Financials are based on the most recent Mortgage that was taken out on this home.
Original Mortgage
$646,000
Interest Rate
6.05%
Mortgage Type
Commercial
Purchase Details
Closed on
Nov 3, 2000
Sold by
Harris Bank Barrington
Bought by
First National Bank Of Joliet and Trust #5496
Home Financials for this Owner
Home Financials are based on the most recent Mortgage that was taken out on this home.
Original Mortgage
$650,000
Interest Rate
7.58%
Mortgage Type
Commercial
Create a Home Valuation Report for This Property
The Home Valuation Report is an in-depth analysis detailing your home's value as well as a comparison with similar homes in the area
Home Values in the Area
Average Home Value in this Area
Purchase History
| Date | Buyer | Sale Price | Title Company |
|---|---|---|---|
| Chicago Title Land Trust Company | -- | Chicago Title & Trust Co | |
| Pratt Richard W | $629,000 | First American Title | |
| Mack Realty Associates Of Illinois Llc | $760,000 | -- | |
| First National Bank Of Joliet | $583,333 | -- |
Source: Public Records
Mortgage History
| Date | Status | Borrower | Loan Amount |
|---|---|---|---|
| Previous Owner | Mack Realty Associates Of Illinois Llc | $646,000 | |
| Previous Owner | First National Bank Of Joliet | $650,000 |
Source: Public Records
Tax History Compared to Growth
Tax History
| Year | Tax Paid | Tax Assessment Tax Assessment Total Assessment is a certain percentage of the fair market value that is determined by local assessors to be the total taxable value of land and additions on the property. | Land | Improvement |
|---|---|---|---|---|
| 2024 | $51,509 | $573,511 | $106,430 | $467,081 |
| 2023 | $53,370 | $524,233 | $97,285 | $426,948 |
| 2022 | $53,370 | $489,115 | $90,768 | $398,347 |
| 2021 | $49,703 | $462,171 | $85,768 | $376,403 |
| 2020 | $47,953 | $440,498 | $81,746 | $358,752 |
| 2019 | $44,304 | $416,310 | $77,257 | $339,053 |
| 2018 | $48,476 | $421,410 | $78,203 | $343,207 |
| 2017 | $48,457 | $416,537 | $77,299 | $339,238 |
| 2016 | $24,298 | $239,873 | $73,200 | $166,673 |
| 2015 | $26,332 | $220,208 | $67,199 | $153,009 |
| 2014 | $26,041 | $213,167 | $62,622 | $150,545 |
| 2012 | $24,518 | $217,008 | $63,750 | $153,258 |
Source: Public Records
Map
Nearby Homes
- 29295 N Callahan Rd
- 26241 W Bonner Rd
- 235 Regency Ct Unit B
- 225 Regency Ct Unit A
- 240 Regency Ct
- 136 Parkview Dr Unit 5136
- 29564 N Garland Rd
- 28855 N Garland Rd
- 26049 N Il Route 59
- 845 Osage Terrace
- 28177 N Garland Rd
- 28722 N Madison Ave
- 225 Larkdale Row
- 0 Bonner Rd
- 29650 N Garland Rd
- 450 N Main St Unit S307A
- 450 N Main St Unit S208A
- 453 Willow Rd
- 335 Farmhill Cir
- 2227 Trailside Ln Unit 1B
- 265 Industrial Dr Unit 265
- 240 Industrial Dr
- 285 Industrial Dr
- 366 Hollow Hill Rd
- 265 Jamie Ln
- 367 Hollow Hill Dr
- 387 Hollow Hill Rd
- 1350 N Old Rand Rd
- 1350 N Old Rand Rd
- 260 Jamie Ln Unit A
- 260 Jamie Ln
- 285 Jamie Ln
- 295 Jamie Ln
- 388 Hollow Hill Rd
- 388 Hollow Hill Rd Unit B
- 275 Jamie Ln
- 391 Hollow Hill Rd
- 1500 Synergy Dr
- 1220 N Old Rand Rd
- 1301 N Old Rand Rd